
Behavioral Health AI
AI Agents for Behavioral Health Operations
Your EHR is not the problem. The disconnection between your EHR, payroll, GL, and outcomes tools is the problem. We build AI agents that bridge these gaps — automating CCBHC reporting, surfacing denial patterns, and giving your leadership team real-time operational intelligence. No system replacements. Results in weeks.
Key Takeaways
Behavioral health organizations run 5-8 disconnected systems. AI agents bridge the gaps — automating CCBHC compliance, surfacing financial risk, and giving leadership teams a single source of truth.
- CCBHC organizations must report across 9 quality domains with data from 3-5 systems
- Behavioral health claim denial rates average 15-20% — 2x the healthcare industry norm
- 85% of BH organizations cite data fragmentation as their top operational challenge
The reporting burden looks different depending on where you sit.
Tell us which role describes you best.
Operations
I run programs and operations
Staff productivity, census, cross-location visibility
Finance
I own revenue and financial reporting
Denial analysis, payer mix, grant tracking
Clinical
I lead clinical programs
CCBHC compliance, outcomes measurement, caseload data
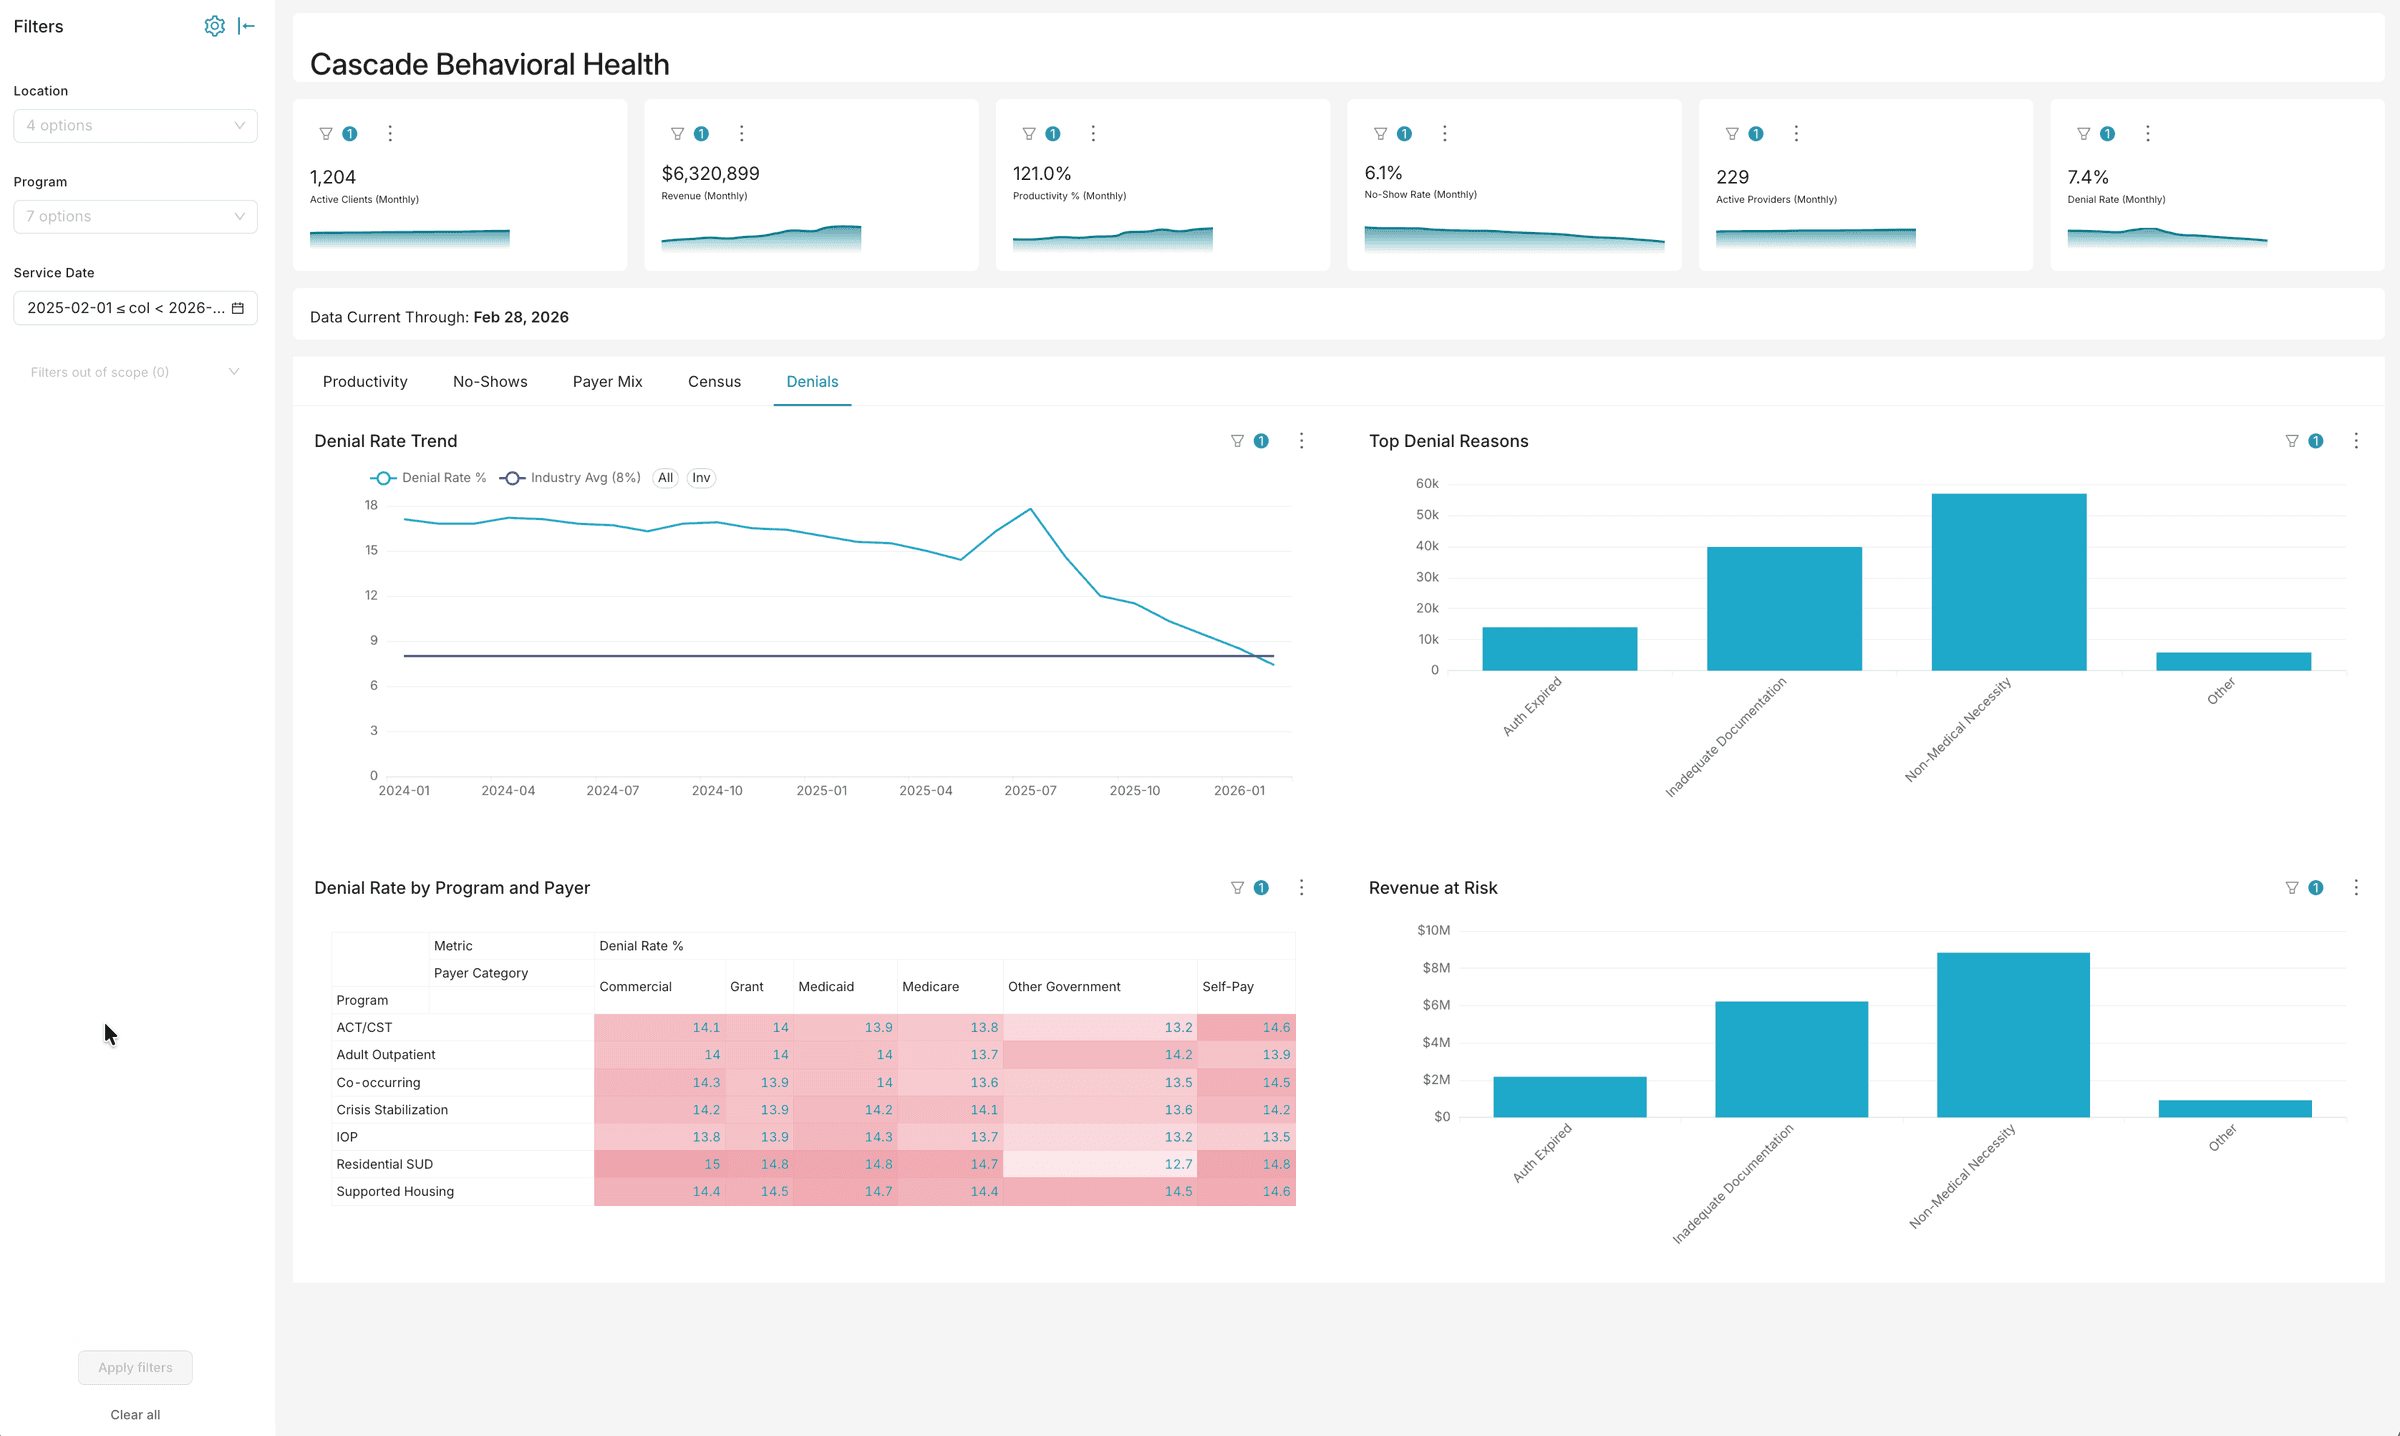
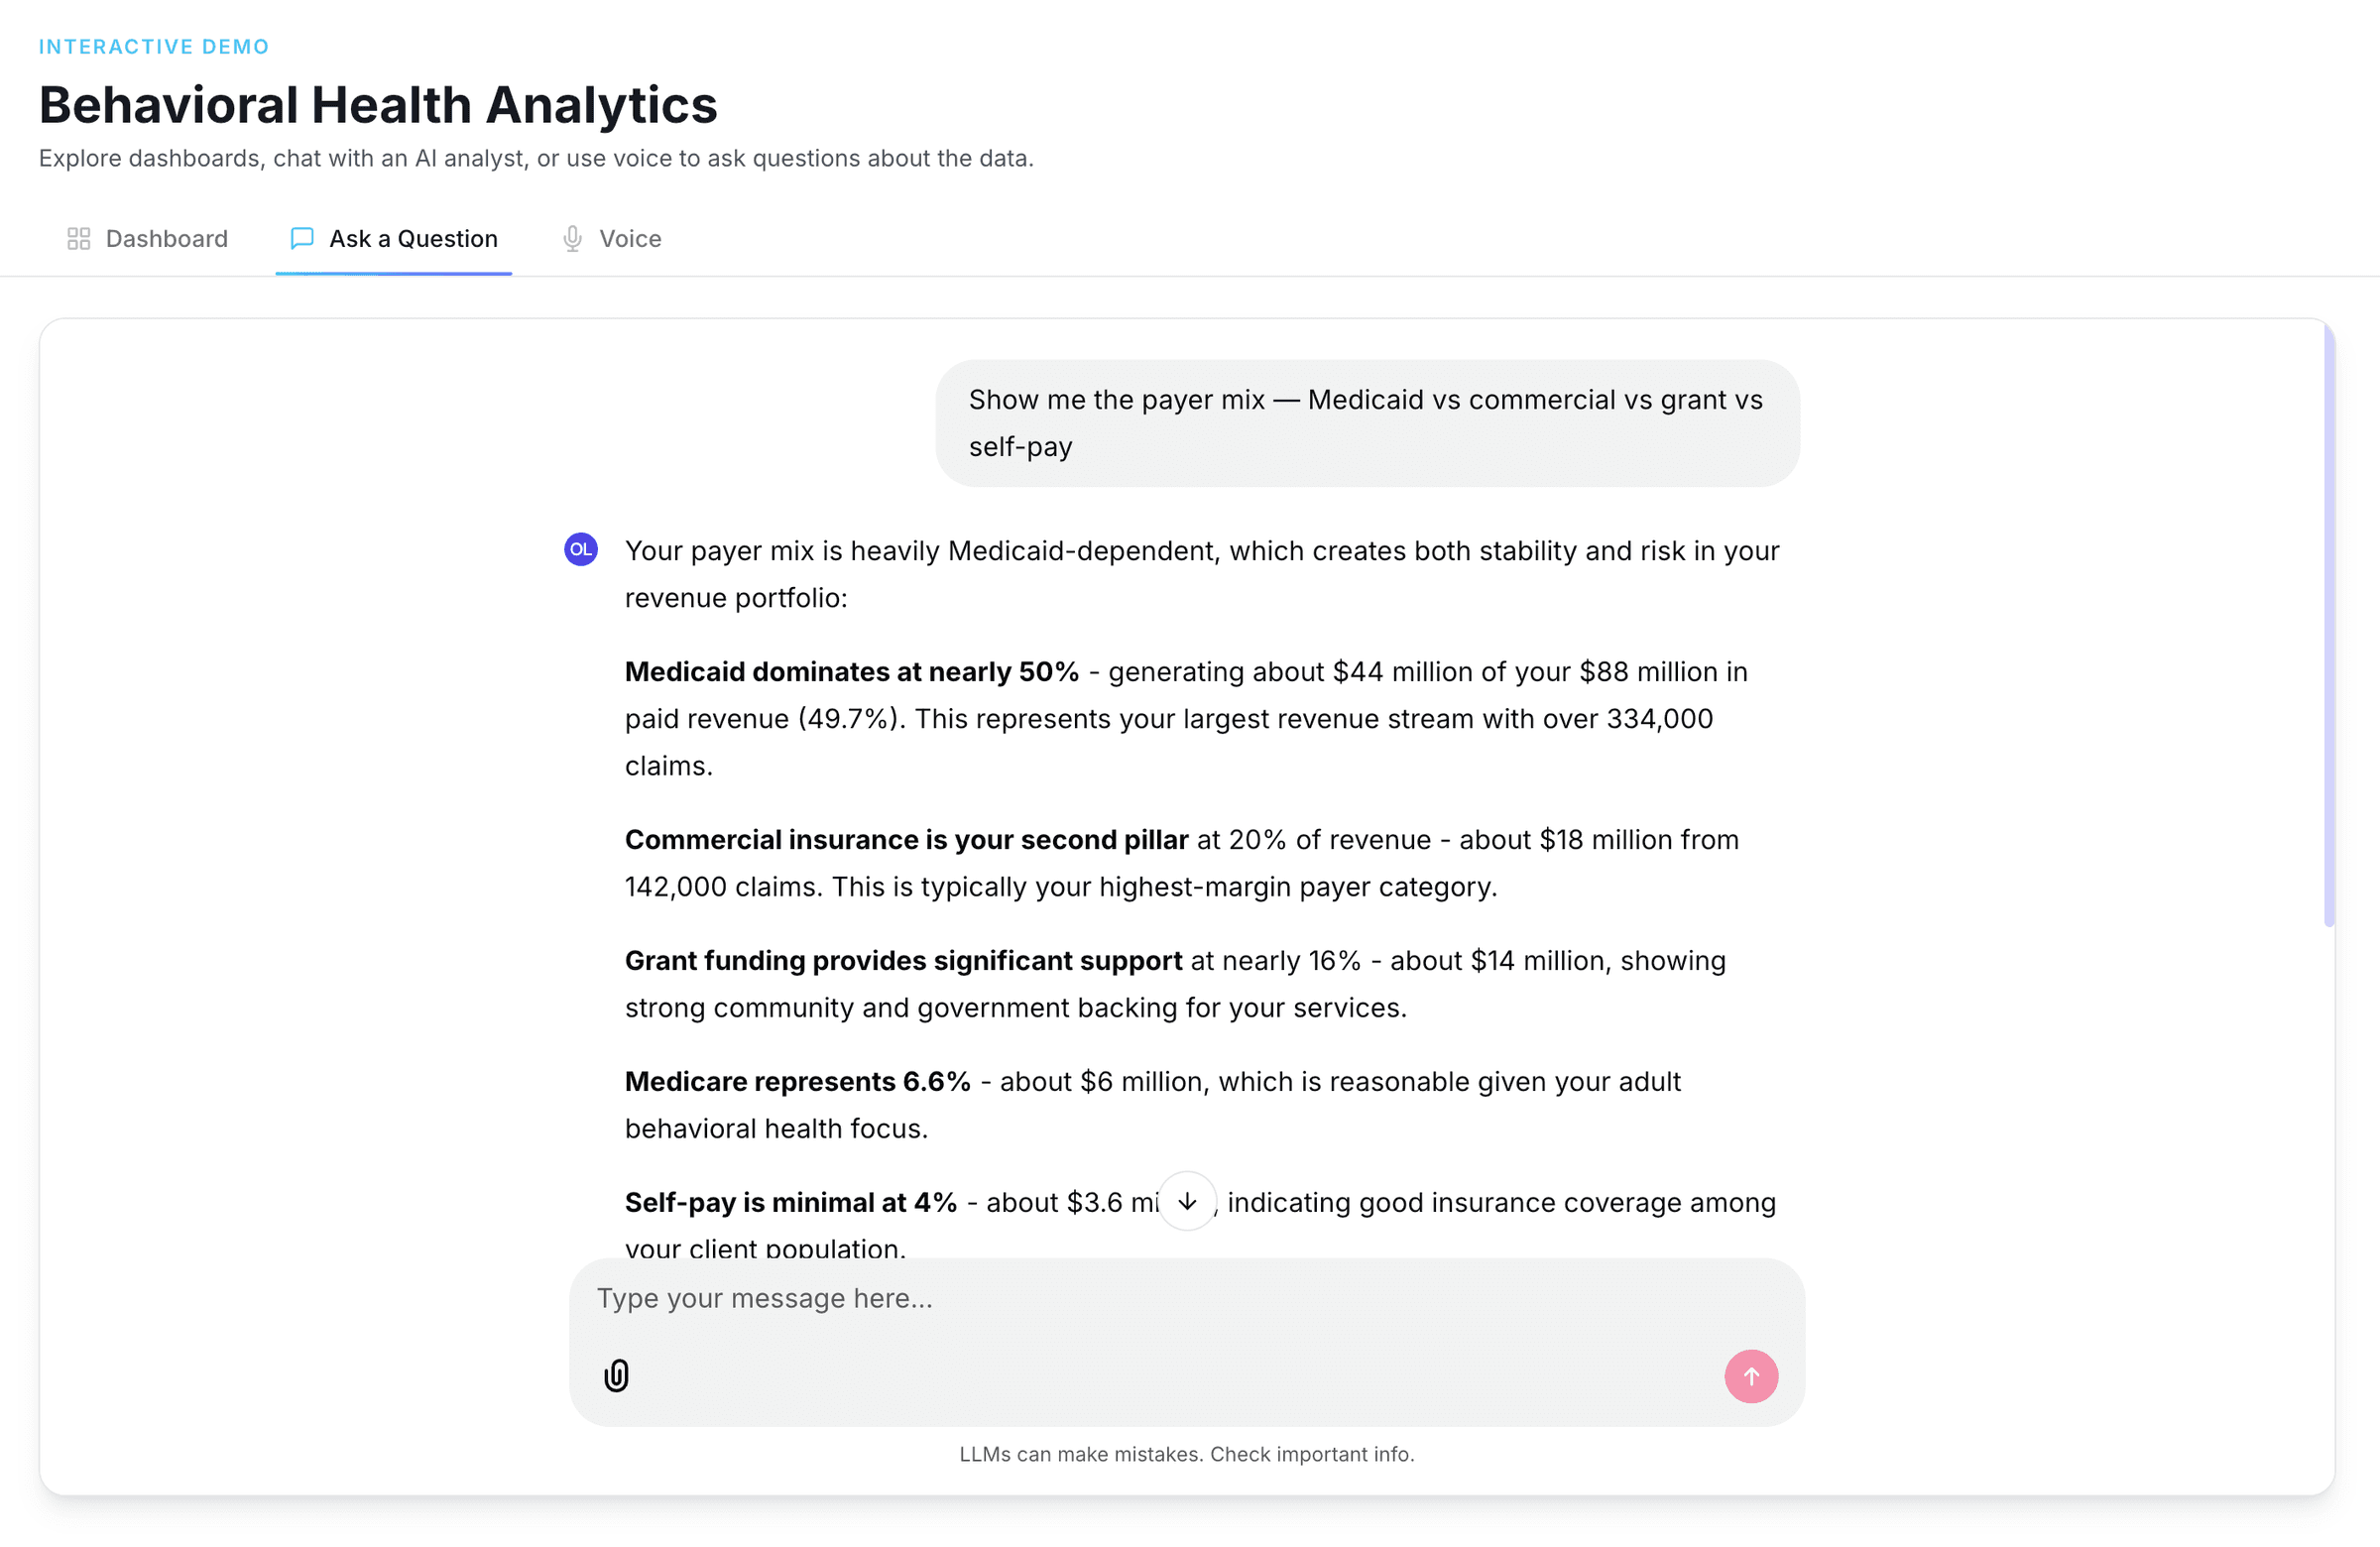
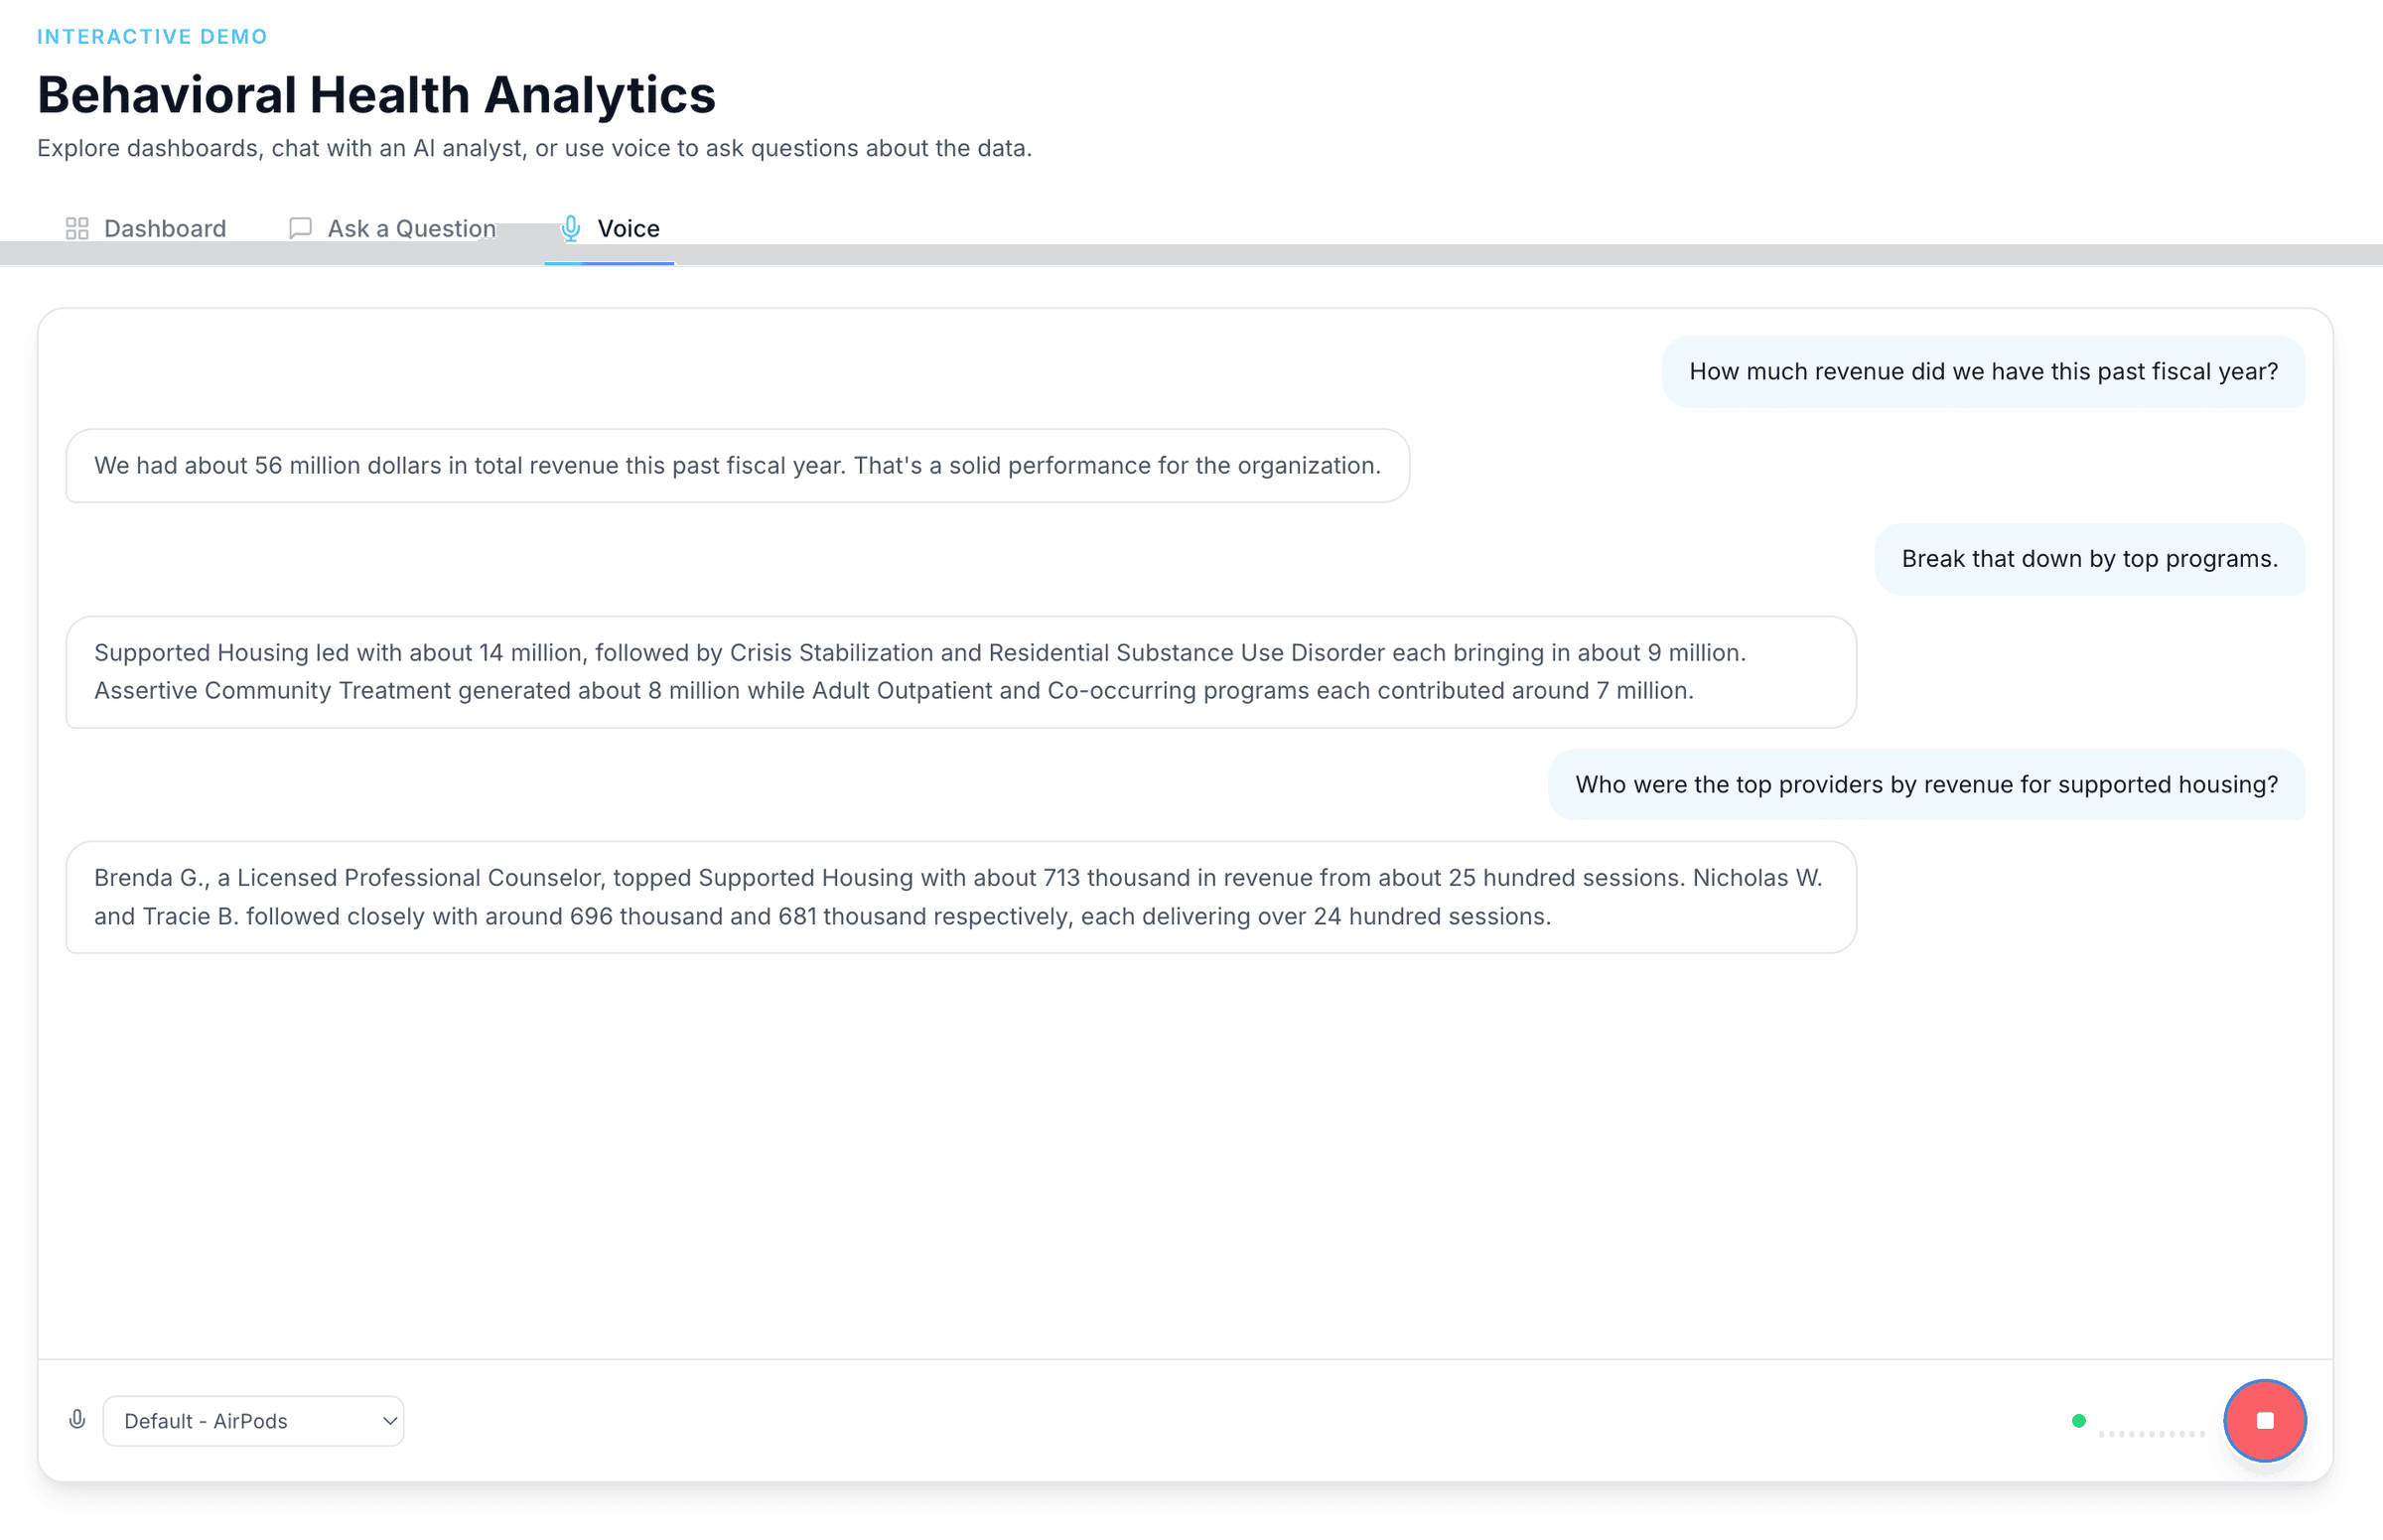
Interactive Demo Preview
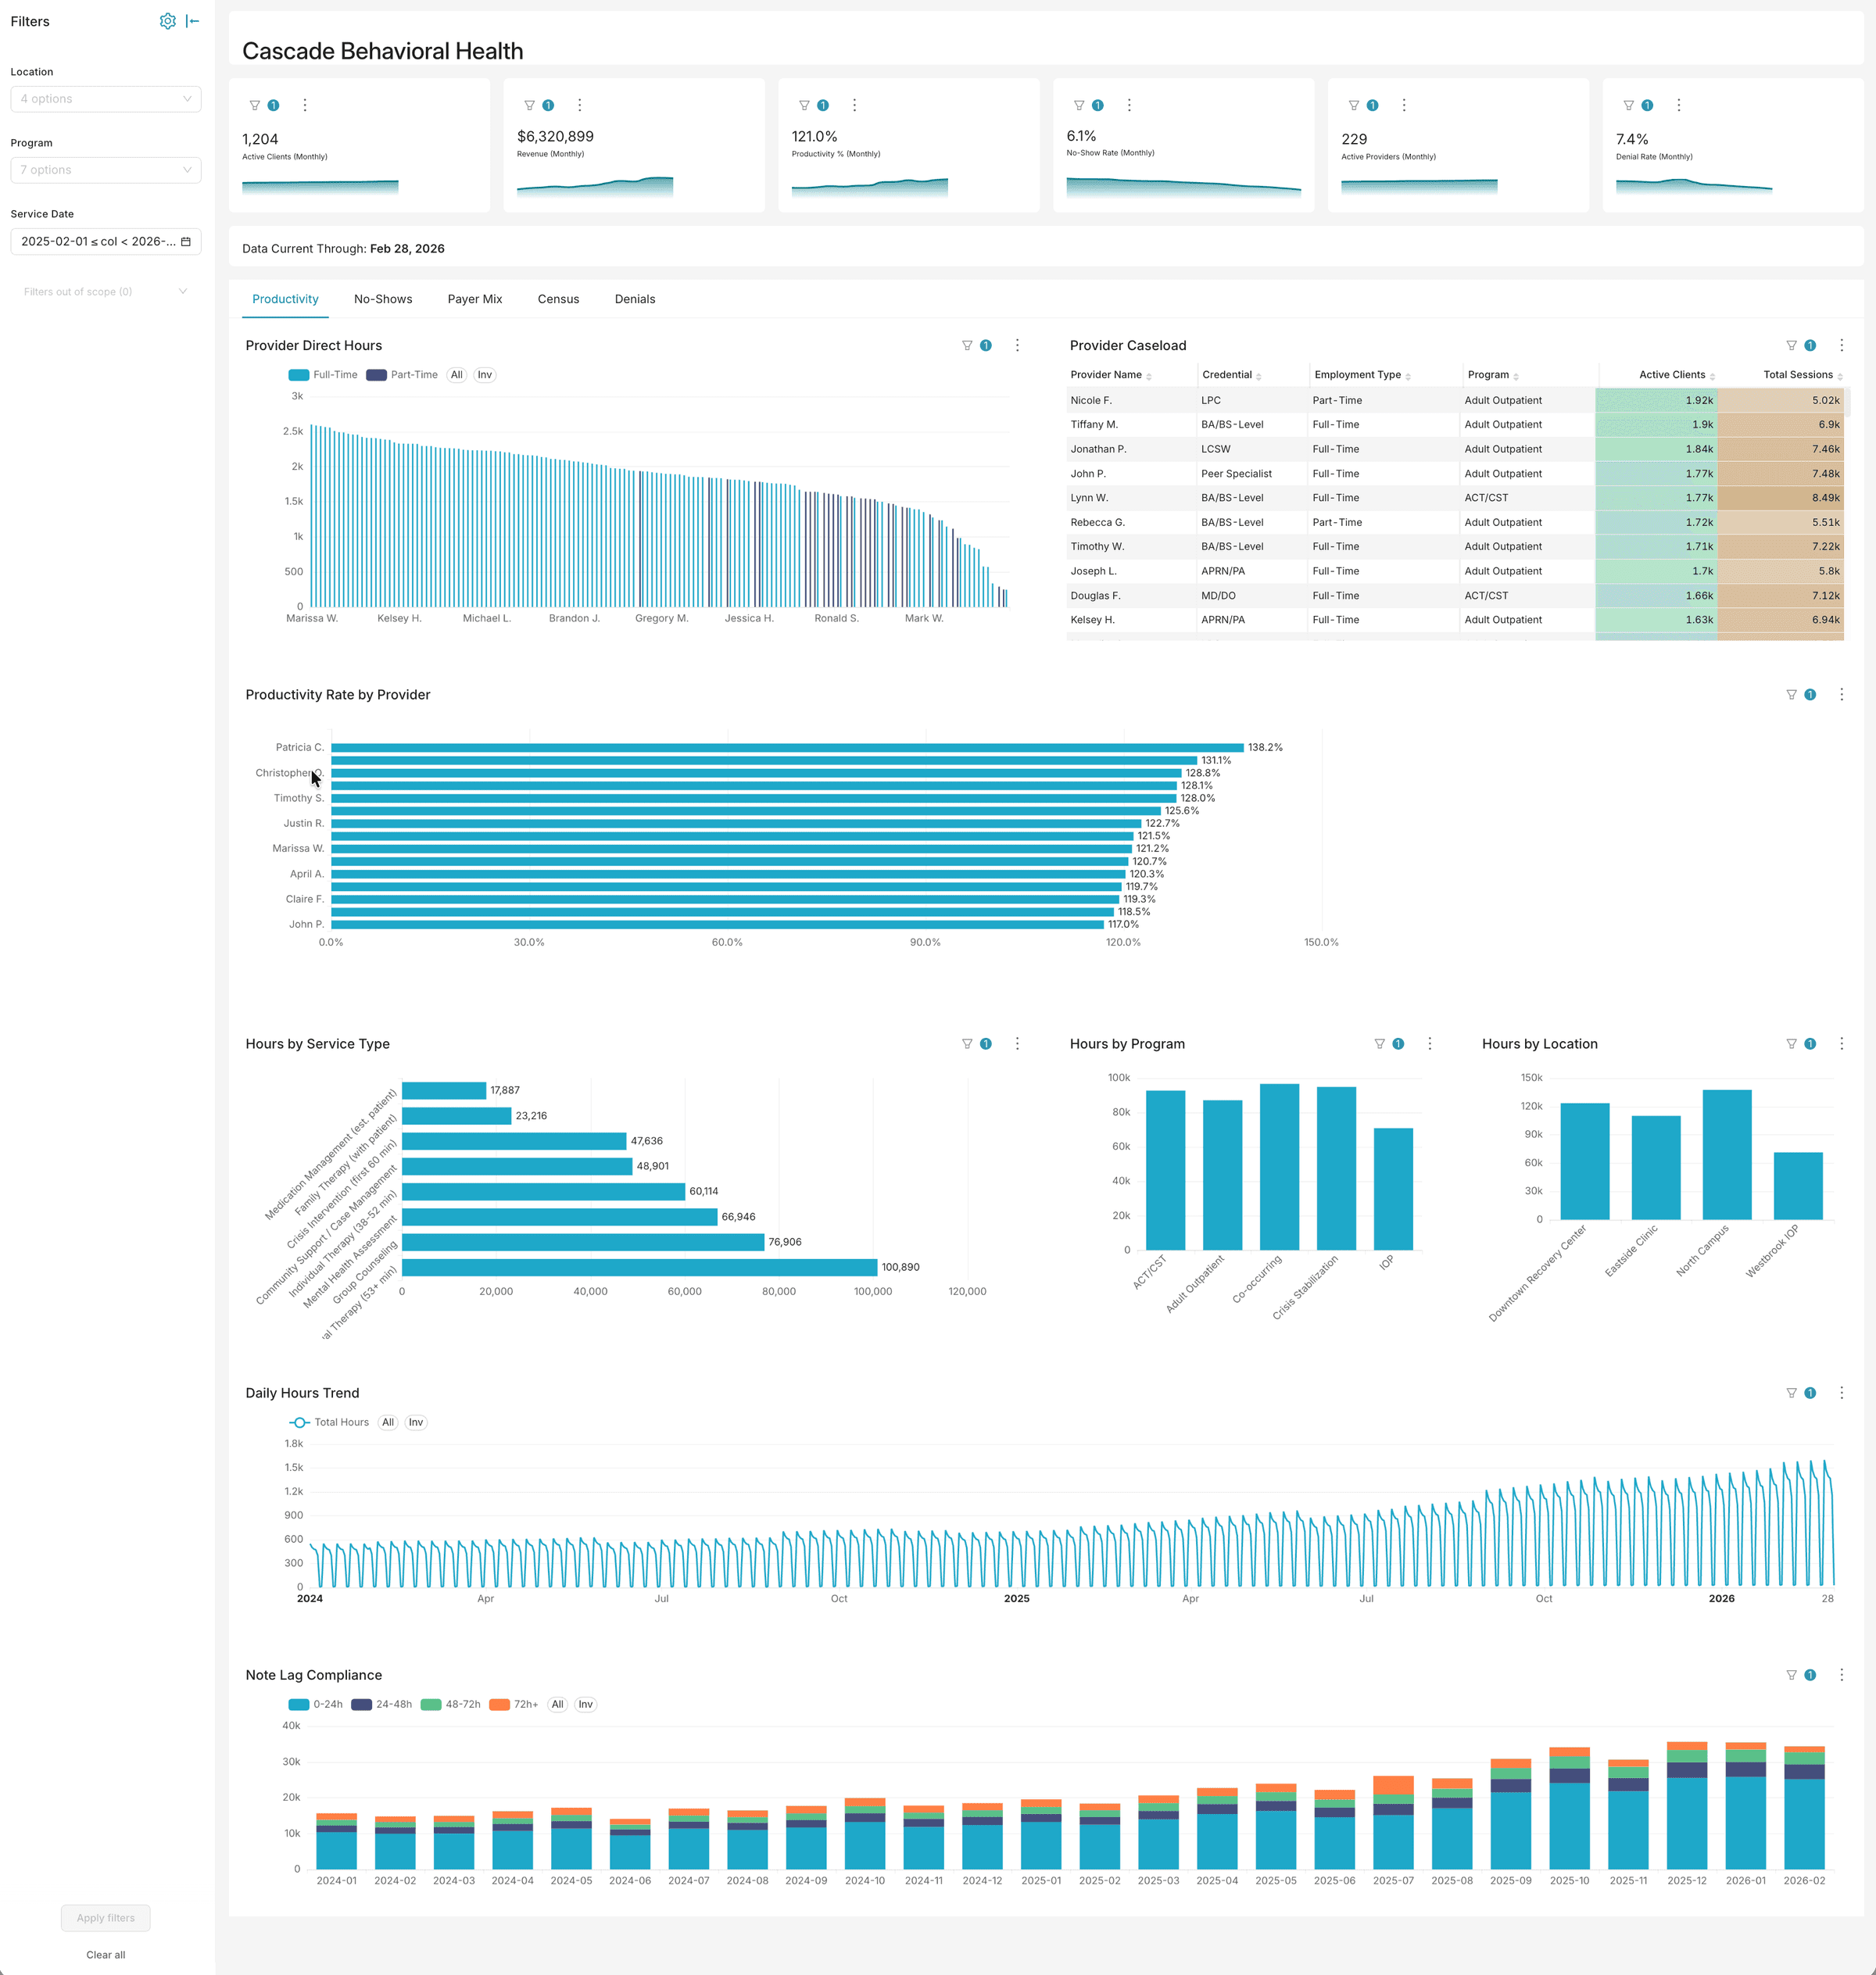
Analytics built for behavioral health operations
Dashboards, AI chat, and voice — three ways to explore your data. No six-month implementation. No data warehouse required.
Want to explore with your own filters?
Try the Interactive DemoThe VisionWrights Pipeline
One unified view of your organization
We extract data from every system your organization already uses, then transform and unify it so your team stops chasing spreadsheets and starts making real-time decisions.
Your Existing Systems
EHR
NextGen · Welligent · myAvatar
Payroll
ADP · Paychex
Finance / GL
QuickBooks · NetSuite
Grant Tracking
Compliance & outcomes data
Outcomes Tools
PHQ-9 · GAD-7
auto-
extracted
VisionWrights
Data Extraction
From every source system
Transformation
Cleaned, joined, normalized
Unified
Data Lake
Org-owned. Queryable. Yours.
surfaced
instantly
What You Get
Analytics Dashboards
Real-time ops & clinical KPIs
CCBHC & Grant Reporting
Automated compliance exports
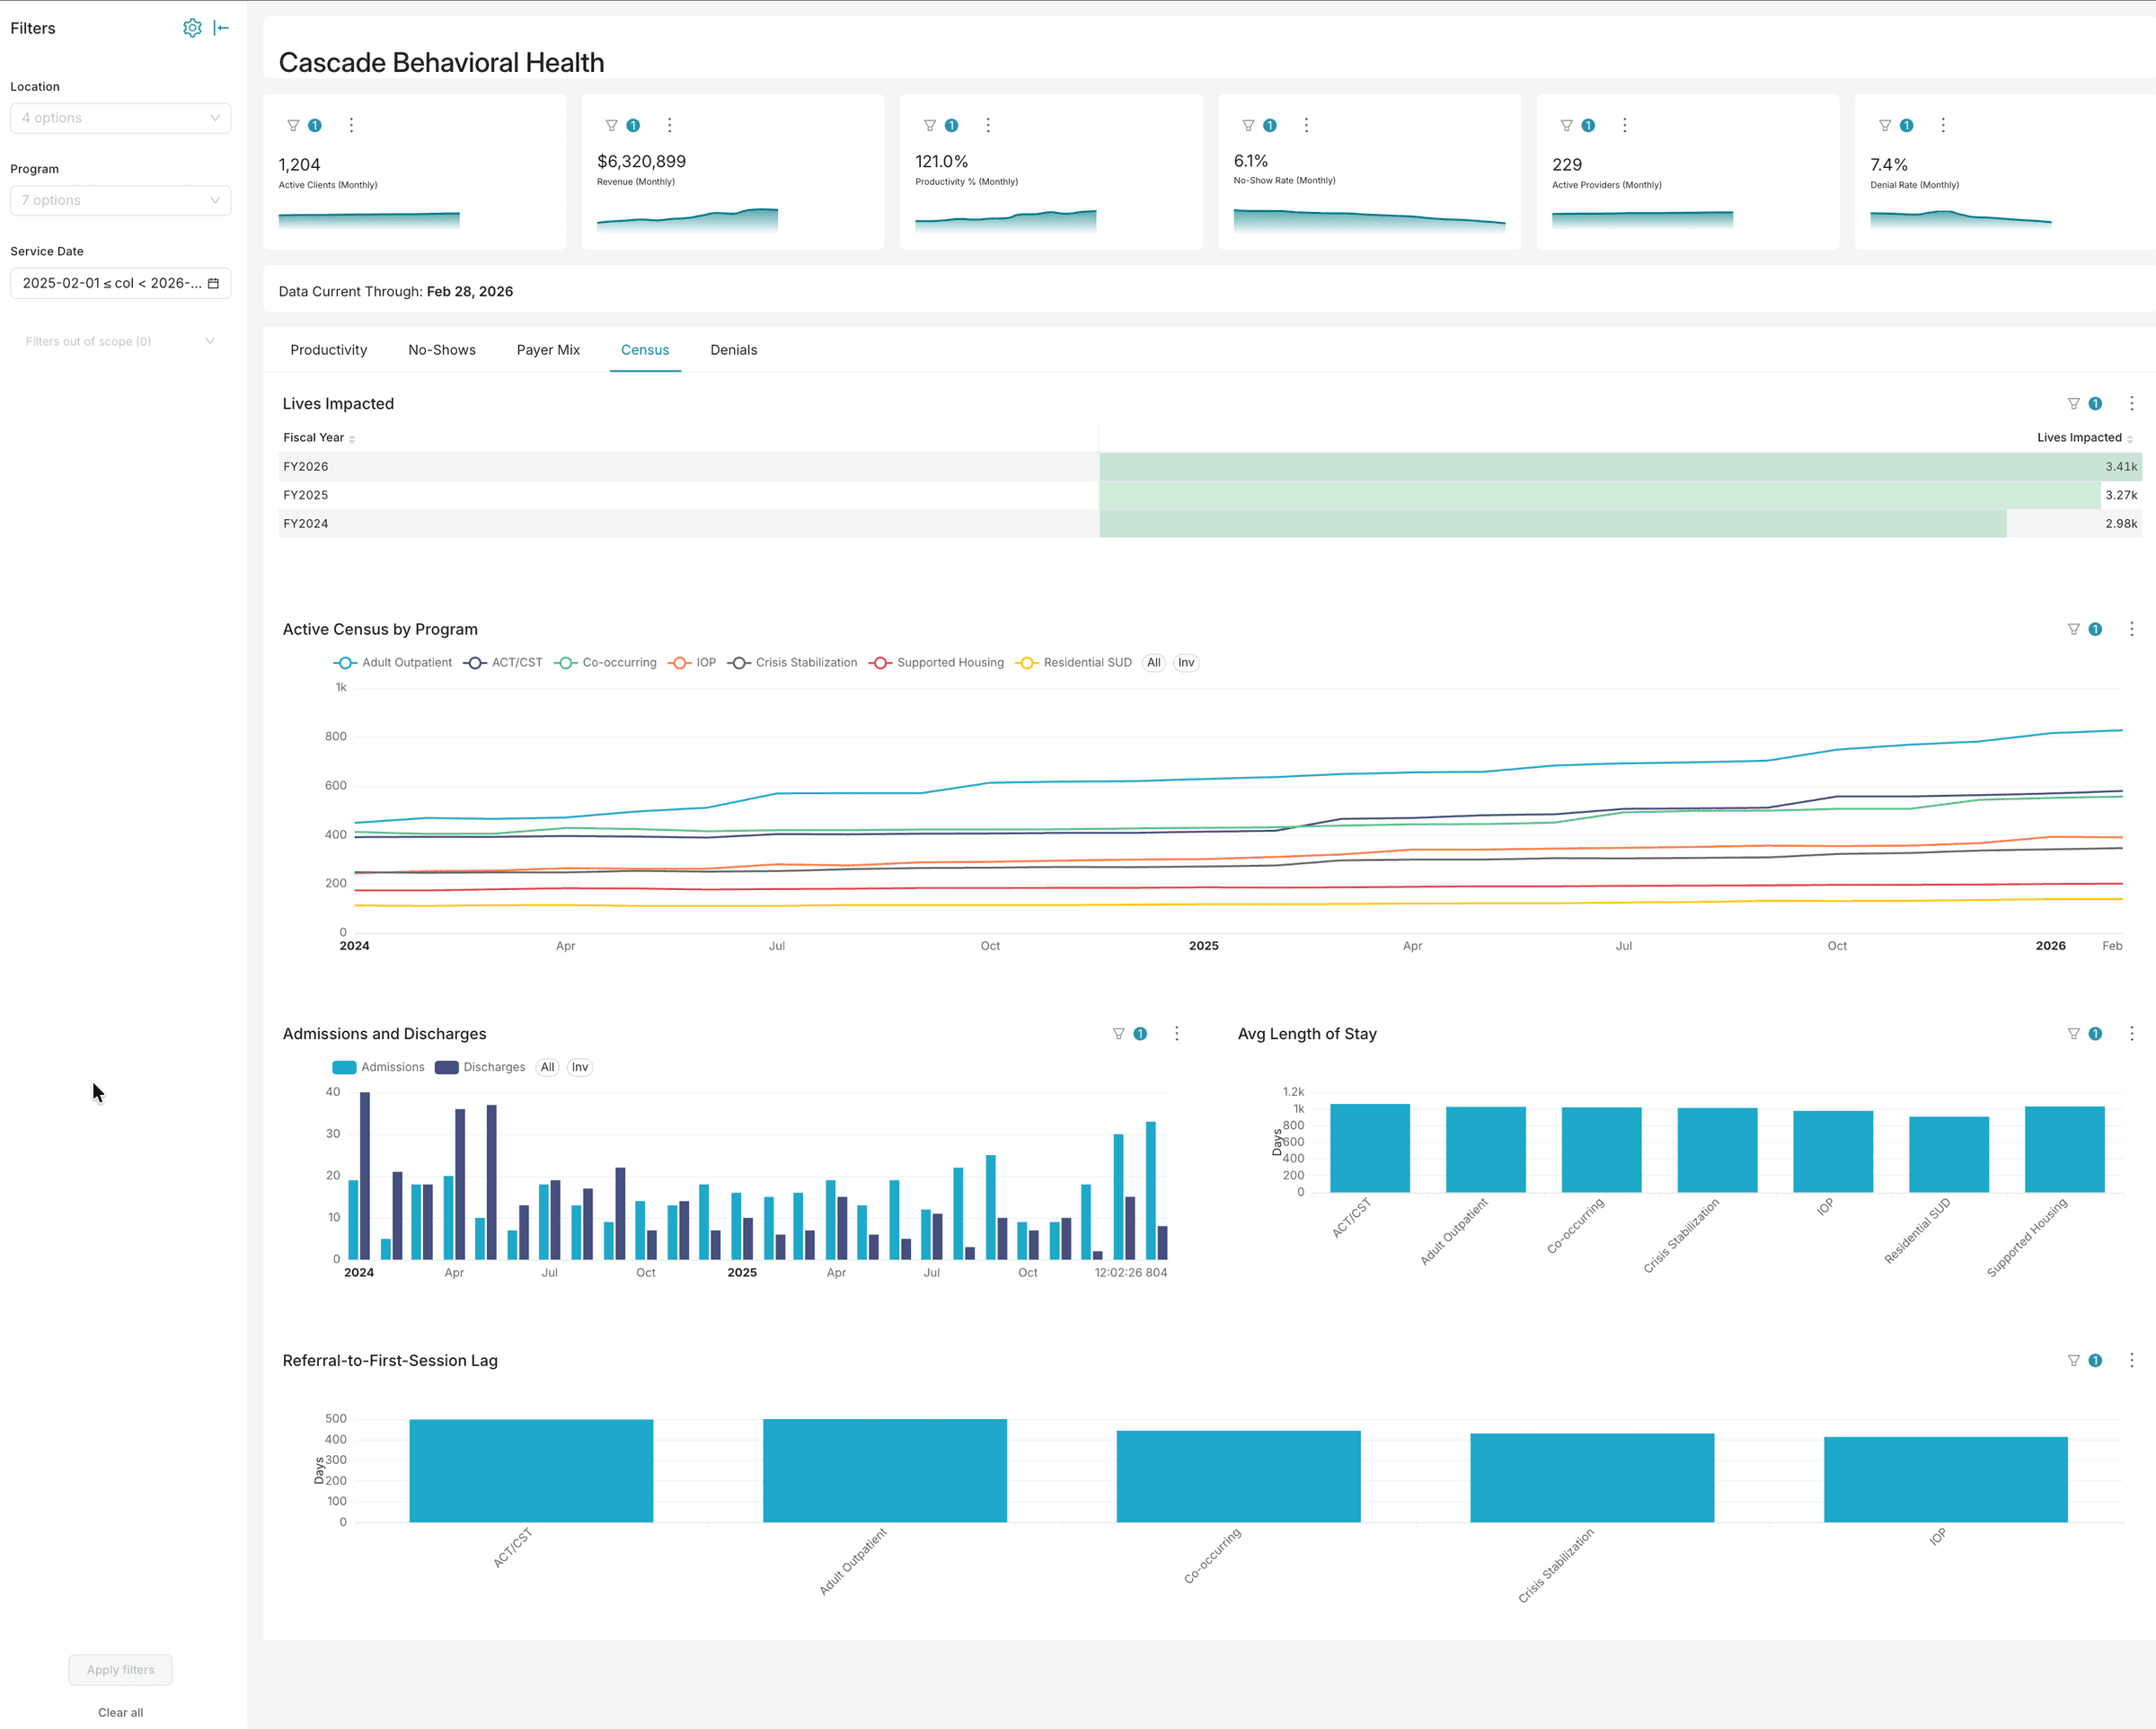
"Lives Served" Metric
Know your impact right now
Cross-Program Insights
Client overlap & program patterns
AI-Ready Data Layer
Structured for what comes next
Your Existing Systems
auto-extracted
VisionWrights Pipeline
Data Extraction
Transformation
Unified Data Lake
surfaced instantly
What You Get
Analytics Dashboards
Real-time ops & clinical KPIs
CCBHC & Grant Reporting
Automated compliance exports
"Lives Served" Metric
Know your impact right now
Cross-Program Insights
Client overlap & program patterns
AI-Ready Data Layer
Structured for what comes next
Behavioral Health by the Numbers
0
CCBHC quality domains requiring cross-system data
0-20%
Average BH claim denial rate
0%
BH orgs citing data fragmentation as top challenge
The Reporting Problem
Behavioral health organizations face a reporting burden that is growing faster than their data infrastructure. CCBHC quality measures, SAMHSA block grant tables, Medicaid managed care outcome requirements, CARF accreditation documentation, and value-based contract compliance all depend on data that spans multiple systems — and no single system was built to produce it.
The EHR holds clinical data. Payroll holds workforce data. The GL holds financial data. Outcome measurement tools hold PHQ-9 and GAD-7 scores. Each system does its job. None of them talks to the others. The reports leadership needs — payer mix by program, staff productivity by caseload, grant deliverables by performance period, denial patterns by service type — require joining all of them. Without a data layer connecting these systems, that work falls to staff with spreadsheets.
We build the layer that connects them.
Where the Gaps Are
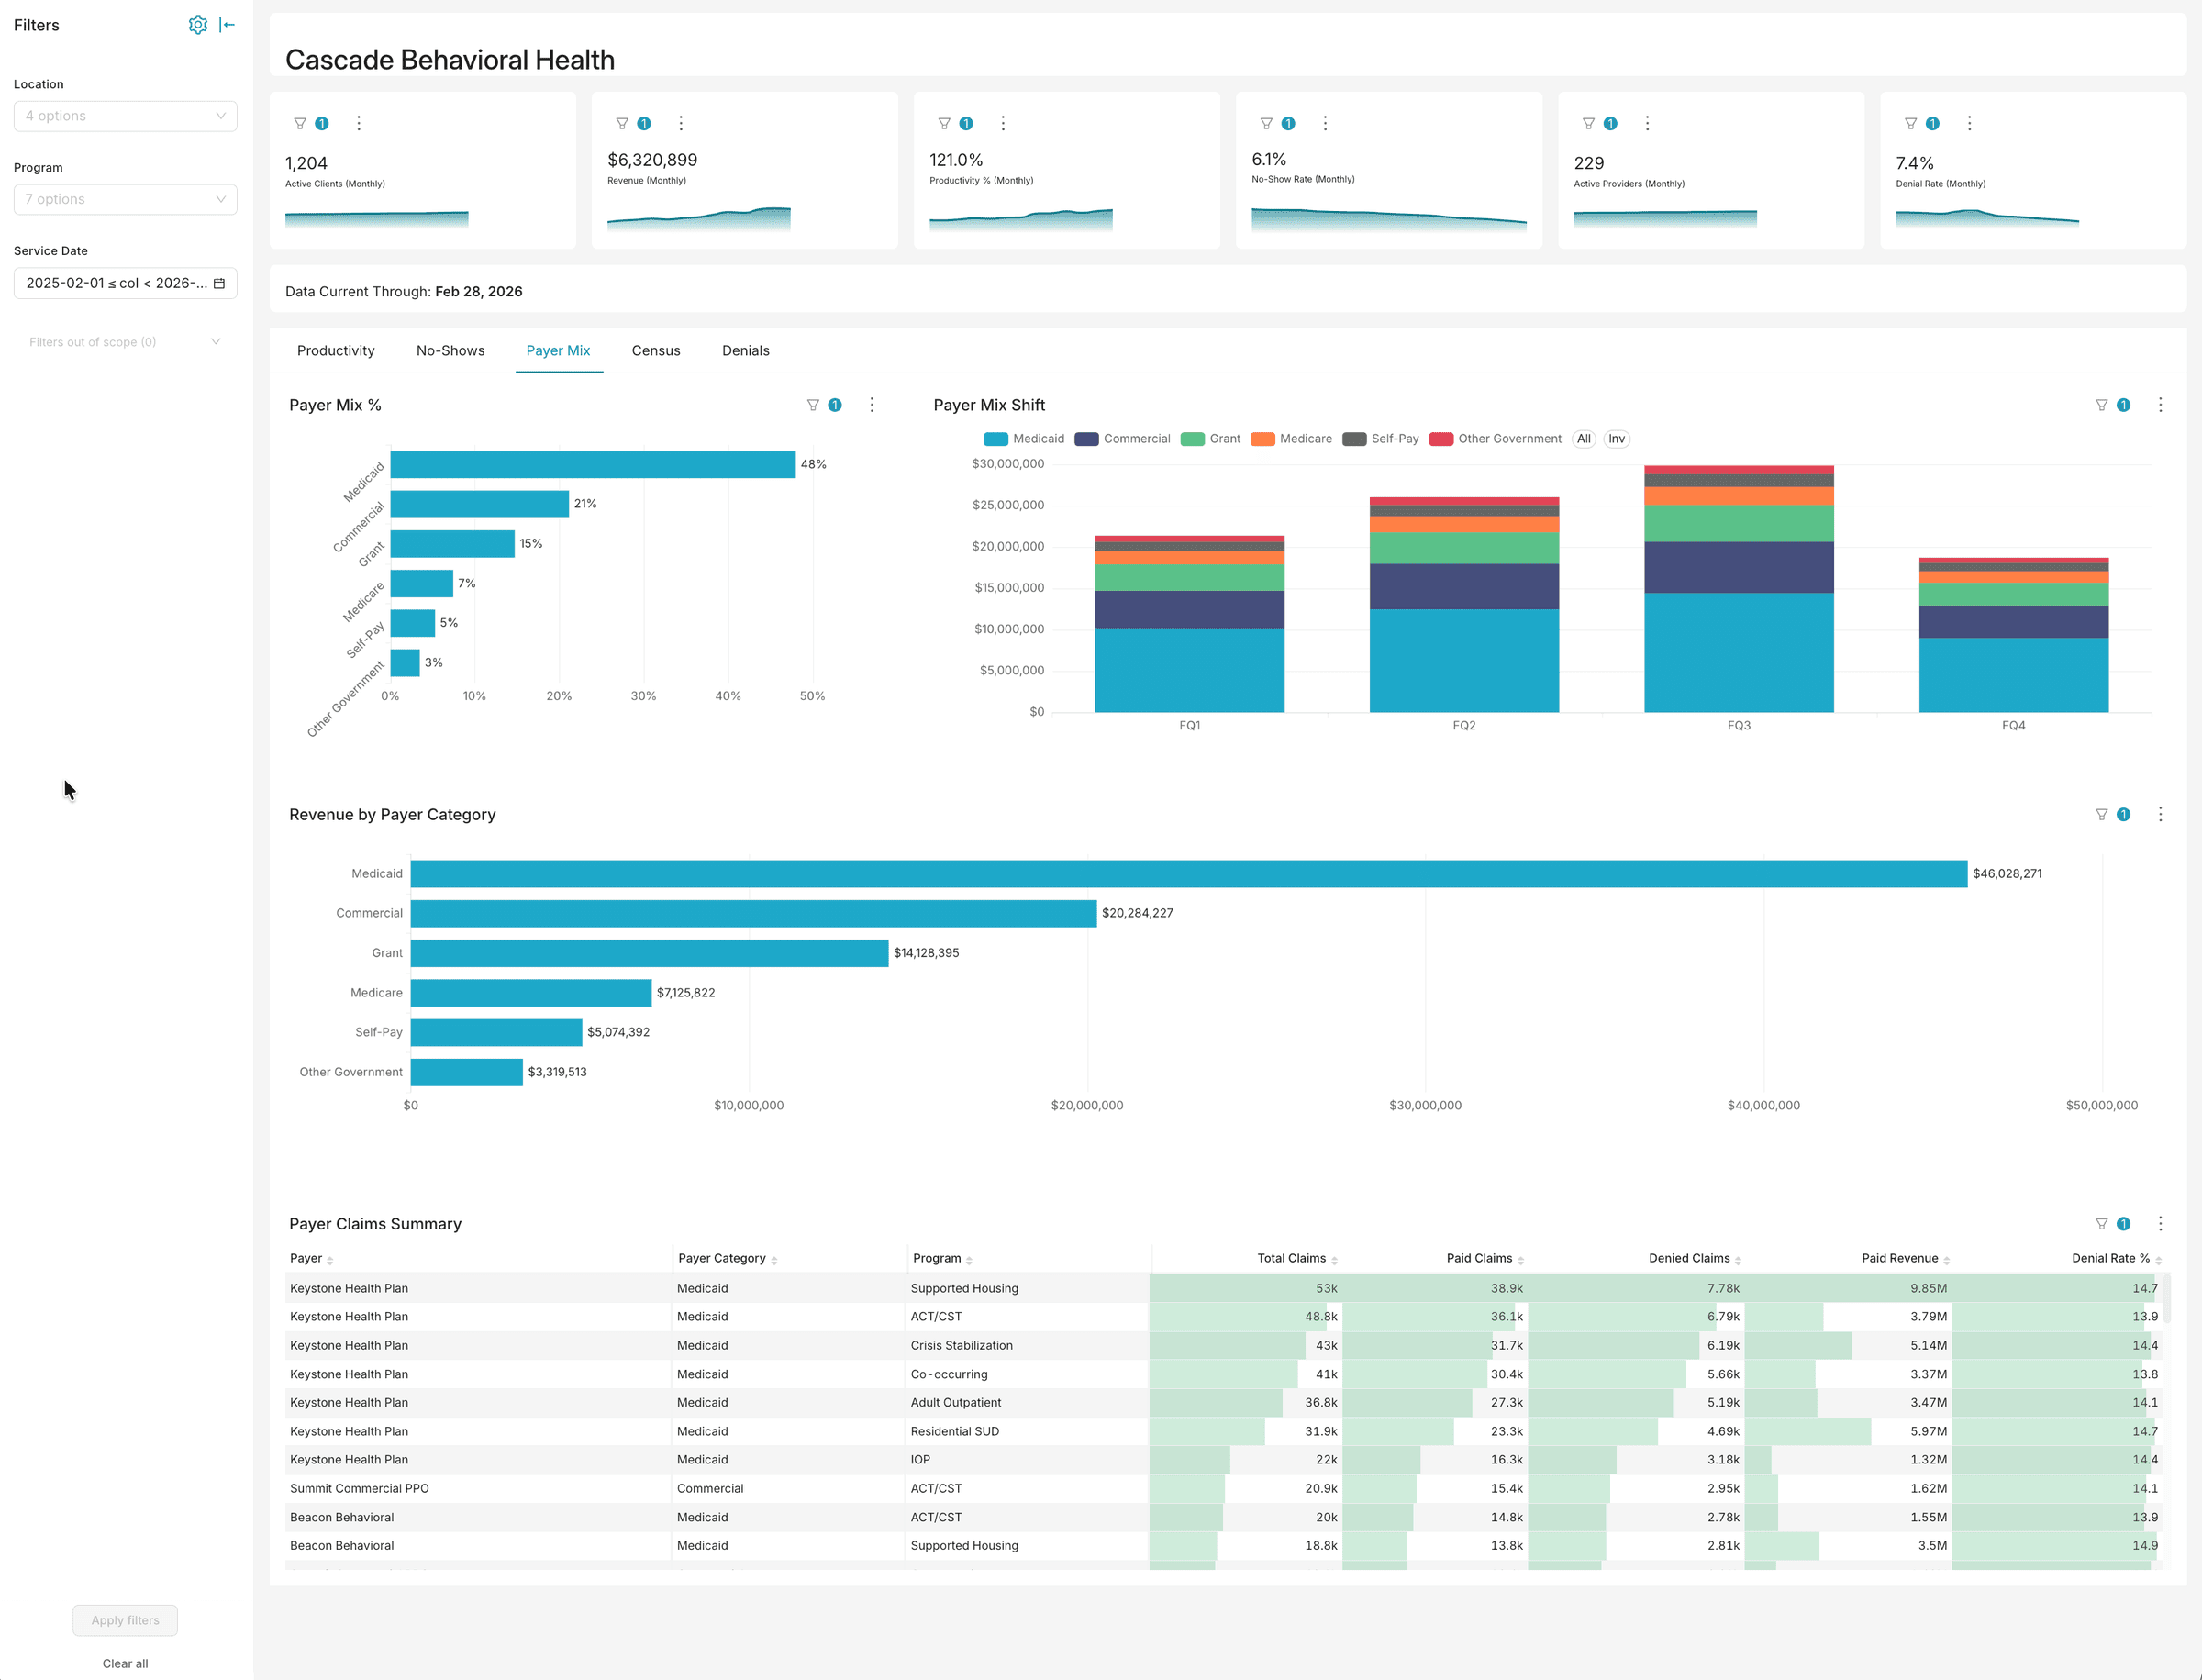
Payer Mix by Program
Medicaid, grant, and commercial coverage require different compliance and documentation. EHR billing modules record transactions — they do not produce program-level payer breakdowns on demand.
Staff Productivity vs. Caseload
Session counts live in the EHR. Hours worked and credential levels live in HR/payroll. No behavioral health EHR joins these natively. Staffing decisions get made without reliable data.
Grant Deliverable Tracking
Grant performance periods do not align with fiscal years or EHR defaults. CCBHC quality measures require custom date filtering across multiple systems. Manual extraction is the norm.
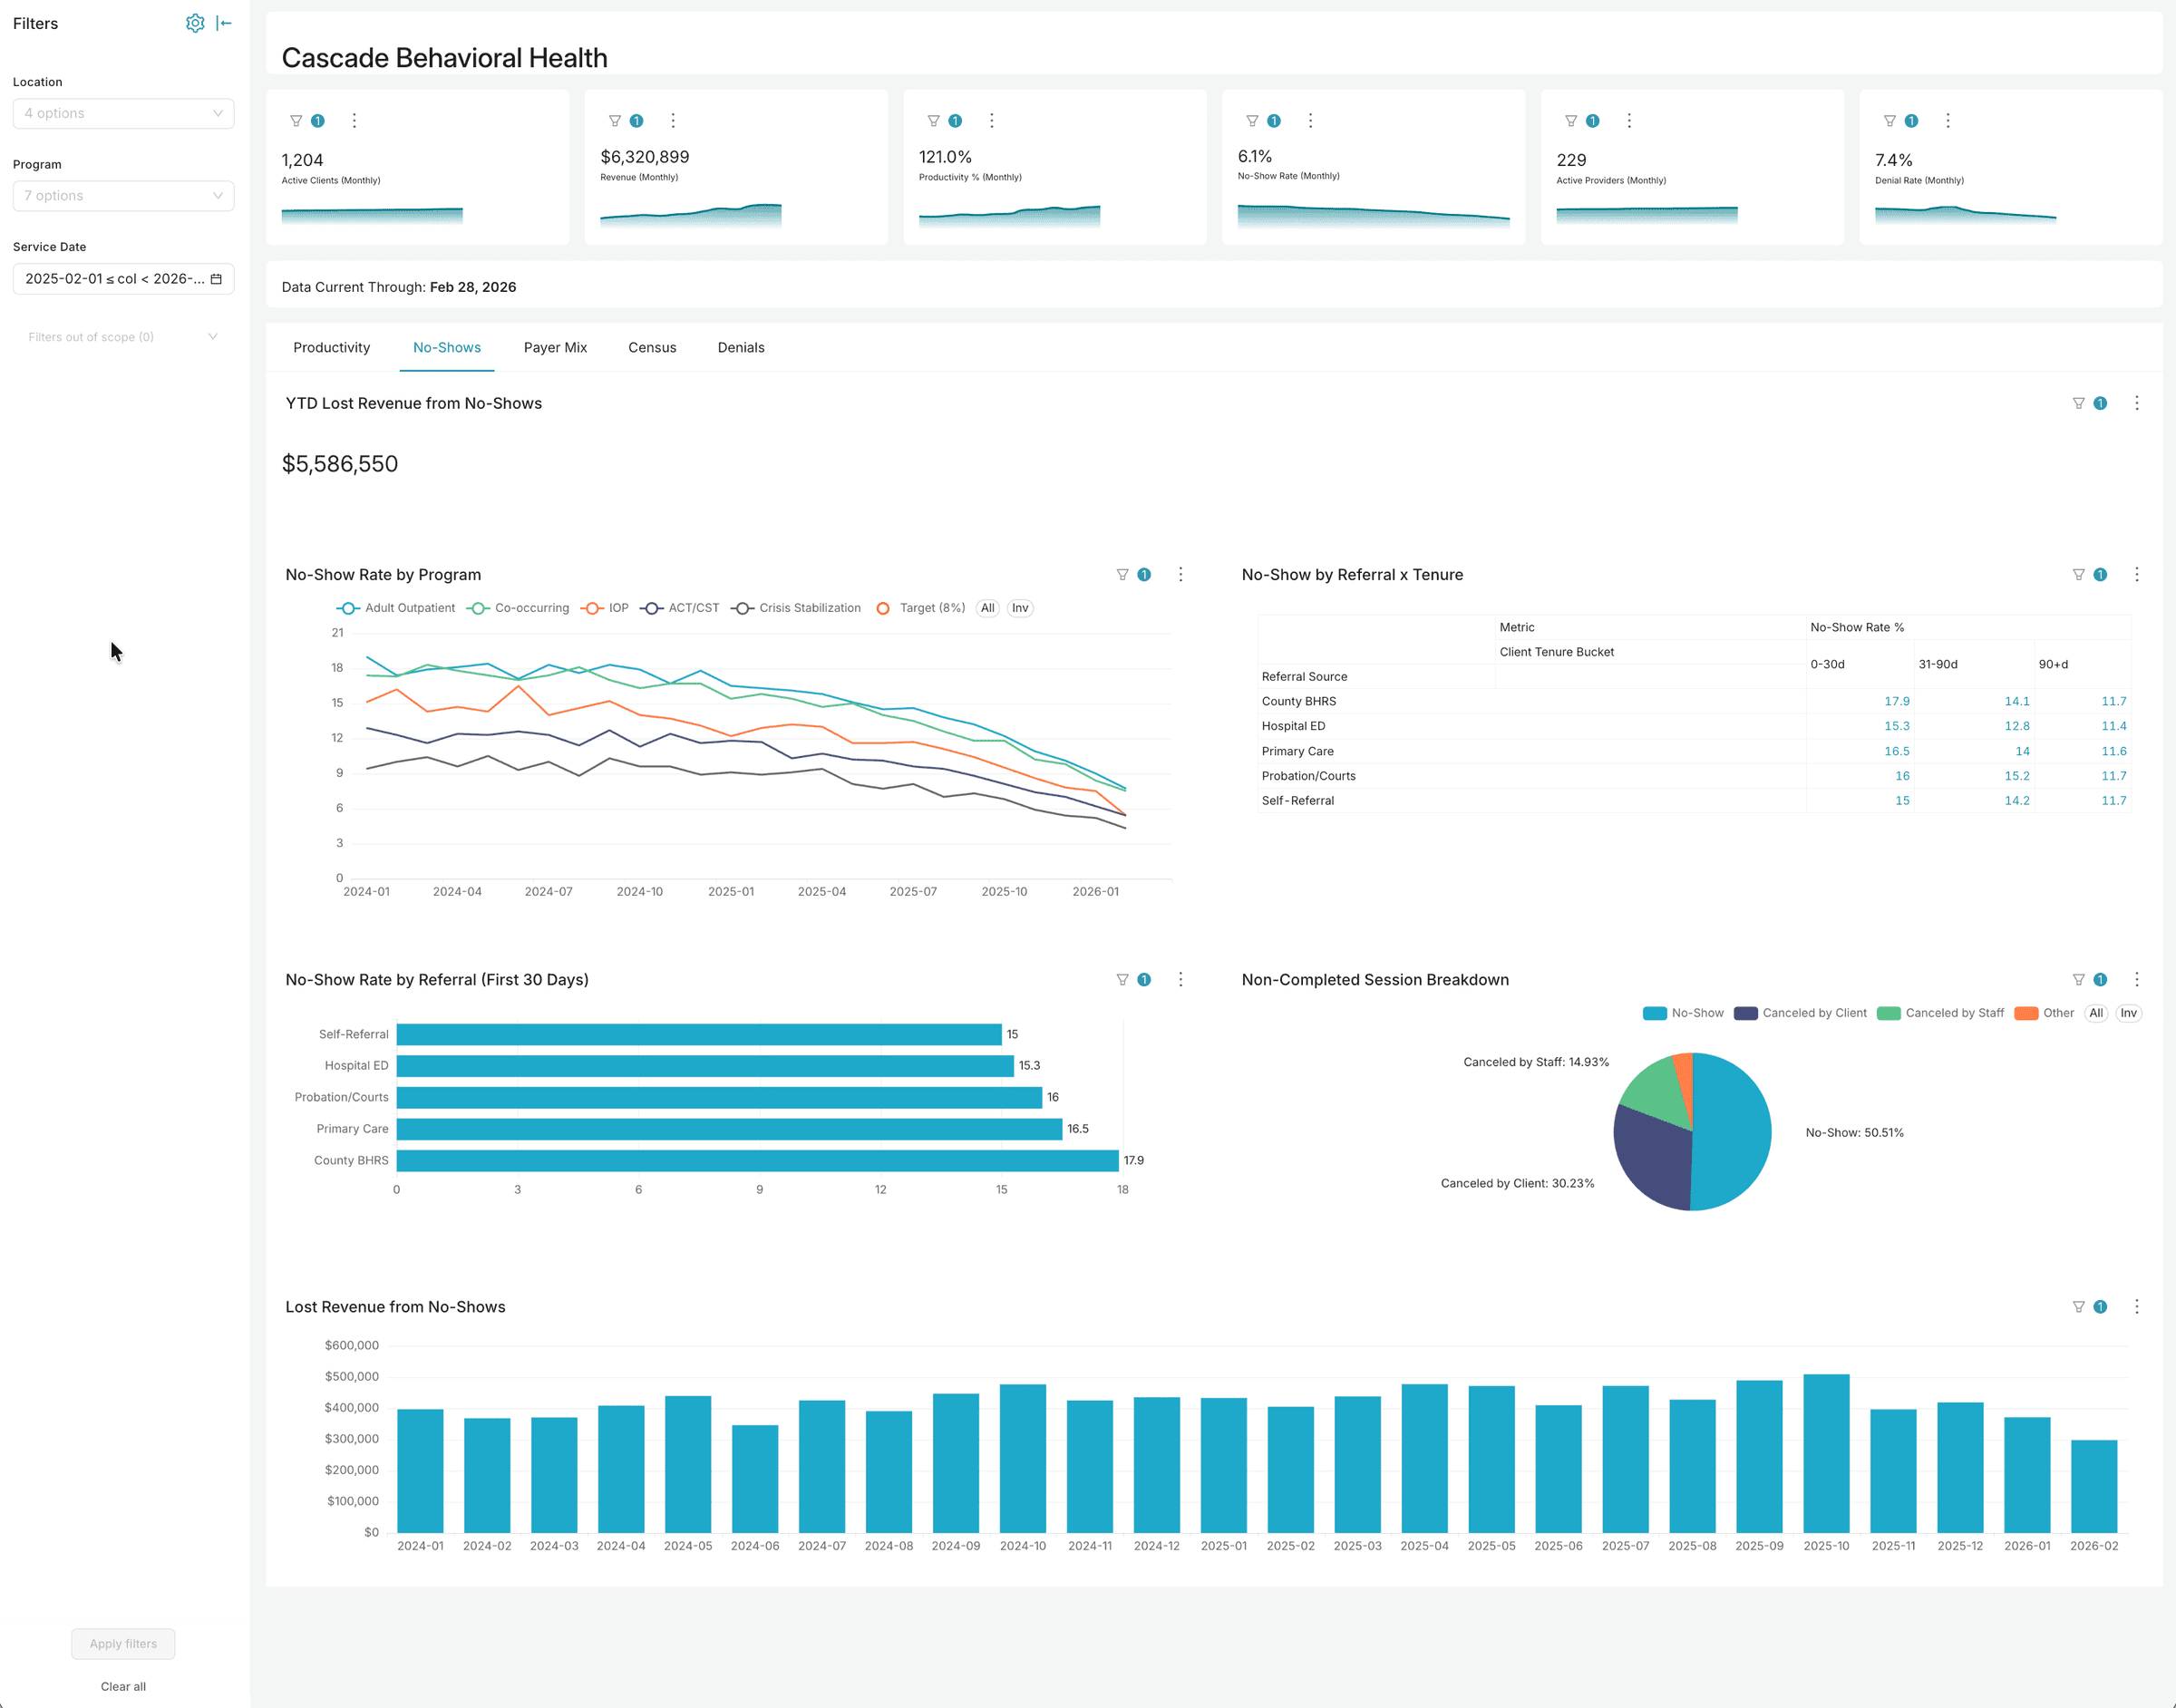
Denial Pattern Analysis
10–20% of behavioral health revenue is lost to preventable denials. Fewer than 1% of denied claims are appealed — because organizations cannot see which claims to pursue.
Clinical Outcomes
PHQ-9, GAD-7, and other outcome instruments typically live in a separate platform from the EHR. Scores exist. They cannot be analyzed alongside treatment data without a connecting layer.
Compliance Reporting
SAMHSA URS, 42 CFR Part 2, CARF MIC documentation, and value-based contract requirements all depend on cross-system data that organizations currently compile by hand.
How We Work
We follow a three-phase approach that most organizations complete in weeks, not quarters.
Assessment. We map your current stack, identify where each data element lives, and define the five to ten reports that would have the most operational impact if they ran automatically.
Build. We connect your source systems through a normalized data warehouse, build the reporting layer, and configure role-based access that satisfies HIPAA requirements from day one. No new EHR. No replacement of existing systems.
Adoption. We train your team to use the dashboards and own the data. The goal is an organization that does not need us to pull a report.
What You Get
Census Dashboards
Real-time and period-over-period census by program, location, and payer — updated automatically, available to all authorized staff.
CCBHC Quality Measure Reports
Automated calculation of required quality measures on calendar-year and custom grant-period bases, with drill-down by program and population.
Staff Productivity Views
Caseload size, billable hours, and session counts joined to payroll data — updated on a defined schedule without manual spreadsheet reconciliation.
Denial Trend Analysis
Denial rates and reasons by program, payer, and service type — so your billing team can see patterns, not just totals.
Grant Deliverable Tracking
Client counts, service units, and outcome data on any grant-year calendar — no manual extraction required at reporting time.
Outcome Measurement Visibility
PHQ-9, GAD-7, and other standardized instruments analyzed alongside treatment and program data. Required for CARF MIC documentation and value-based contracts.
Results in Practice
A behavioral health organization operating 90+ service locations across multiple regions was compiling all five report categories above manually — pulling from three disconnected systems every week. The billing summary alone projected 570 staff-hours per month.
After building the unified analytics layer, all five categories became automated. Projected annual savings in staff time: $736,920. In a post-implementation review, one regional leader said: "If the hours-worked numbers are accurate, this is a game changer."
Insights for Behavioral Health

Data Strategy
Most organizations handling PHI don't actually know where it goes.
Ask most compliance officers where PHI flows across their vendor stack and you'll get a partial answer. Ask specifically about AI tools and it gets hazier. The gap between where you think your data is and where it actually is — that's the risk.

Artificial Intelligence
Cloud AI plus a contract isn't the same as keeping AI off your data.
Regulated organizations are being told that a BAA makes cloud AI HIPAA-safe. That framing misses the question security reviewers are actually asking.

Artificial Intelligence
AI keeps dying in security review. Here's the fix.
Security reviewers kill more AI projects than technical failures do. The question they're asking — where does our data go? — has an answer. It just isn't a contract.
Who This Is For
CCBHC-certified or aspiring behavioral health organizations ($20M–$200M) running NextGen, Welligent, or myAvatar alongside disconnected payroll, GL, and outcomes tools.
What We Do
- EHR + payroll + GL + outcomes tool data unification
- Automated CCBHC quality measure reporting
- Denial pattern detection and revenue cycle optimization
- Grant reporting automation across federal and state programs
- Real-time census, utilization, and staffing dashboards
Outcomes
- CCBHC reporting automated from weeks to hours
- Denial rates reduced by 25-40% through pattern detection
- Real-time operational dashboards replacing quarterly board reports
What Reports Can't You Get Today?
Tell us what your current systems can't produce. We'll show you what an AI agent could do about it — without replacing anything you already run.
Explore Related Concepts
Powered by Say What? — our AI & Data knowledge explorer