
Behavioral Health · Operations
You manage 10, 50, or 90 locations. You shouldn't need a spreadsheet to see how they're doing.
Your EHR tracks sessions. Your payroll system tracks hours. No system joins them. We build the layer that does.
The VisionWrights Pipeline
One unified view of your organization
We extract data from every system your organization already uses, then transform and unify it so your team stops chasing spreadsheets and starts making real-time decisions.
Your Existing Systems
EHR
NextGen · Welligent · myAvatar
Payroll
ADP · Paychex
Finance / GL
QuickBooks · NetSuite
Grant Tracking
Compliance & outcomes data
Outcomes Tools
PHQ-9 · GAD-7
auto-
extracted
VisionWrights
Data Extraction
From every source system
Transformation
Cleaned, joined, normalized
Unified
Data Lake
Org-owned. Queryable. Yours.
surfaced
instantly
What You Get
Analytics Dashboards
Real-time ops & clinical KPIs
CCBHC & Grant Reporting
Automated compliance exports
"Lives Served" Metric
Know your impact right now
Cross-Program Insights
Client overlap & program patterns
AI-Ready Data Layer
Structured for what comes next
Your Existing Systems
auto-extracted
VisionWrights Pipeline
Data Extraction
Transformation
Unified Data Lake
surfaced instantly
What You Get
Analytics Dashboards
Real-time ops & clinical KPIs
CCBHC & Grant Reporting
Automated compliance exports
"Lives Served" Metric
Know your impact right now
Cross-Program Insights
Client overlap & program patterns
AI-Ready Data Layer
Structured for what comes next
The Problem
Every week, someone at your organization is pulling reports from the EHR, cross-referencing payroll, and building a spreadsheet that leadership will read on Monday. That work takes hours. It happens at every location. And when the numbers don't match — because they never quite match — someone has to explain why.
The problem isn't your staff. It's that none of your systems were built to talk to each other. Welligent holds session data. ADP or Paychex holds hours. QuickBooks holds financials. Without a layer connecting them, your team is the connector.
We build that layer. Most organizations complete it in weeks.
What You Get
Census Dashboards
Real-time census by program, location, and payer — updated automatically from your EHR.
Staff Productivity Views
Caseload size, billable hours, and session counts joined to payroll data — no manual cross-referencing.
Cross-Location Comparison
Side-by-side program performance across regions — no manual compilation required.
Cross-Program Insights
Client overlap, service patterns, and resource allocation visible in a single view.
Automated Report Distribution
Weekly reports delivered to regional directors automatically — without staff intervention.
See It In Action
Purpose-built dashboards, not generic charts
Every view is designed for behavioral health workflows — built from your EHR data, updated daily, ready to use from day one.
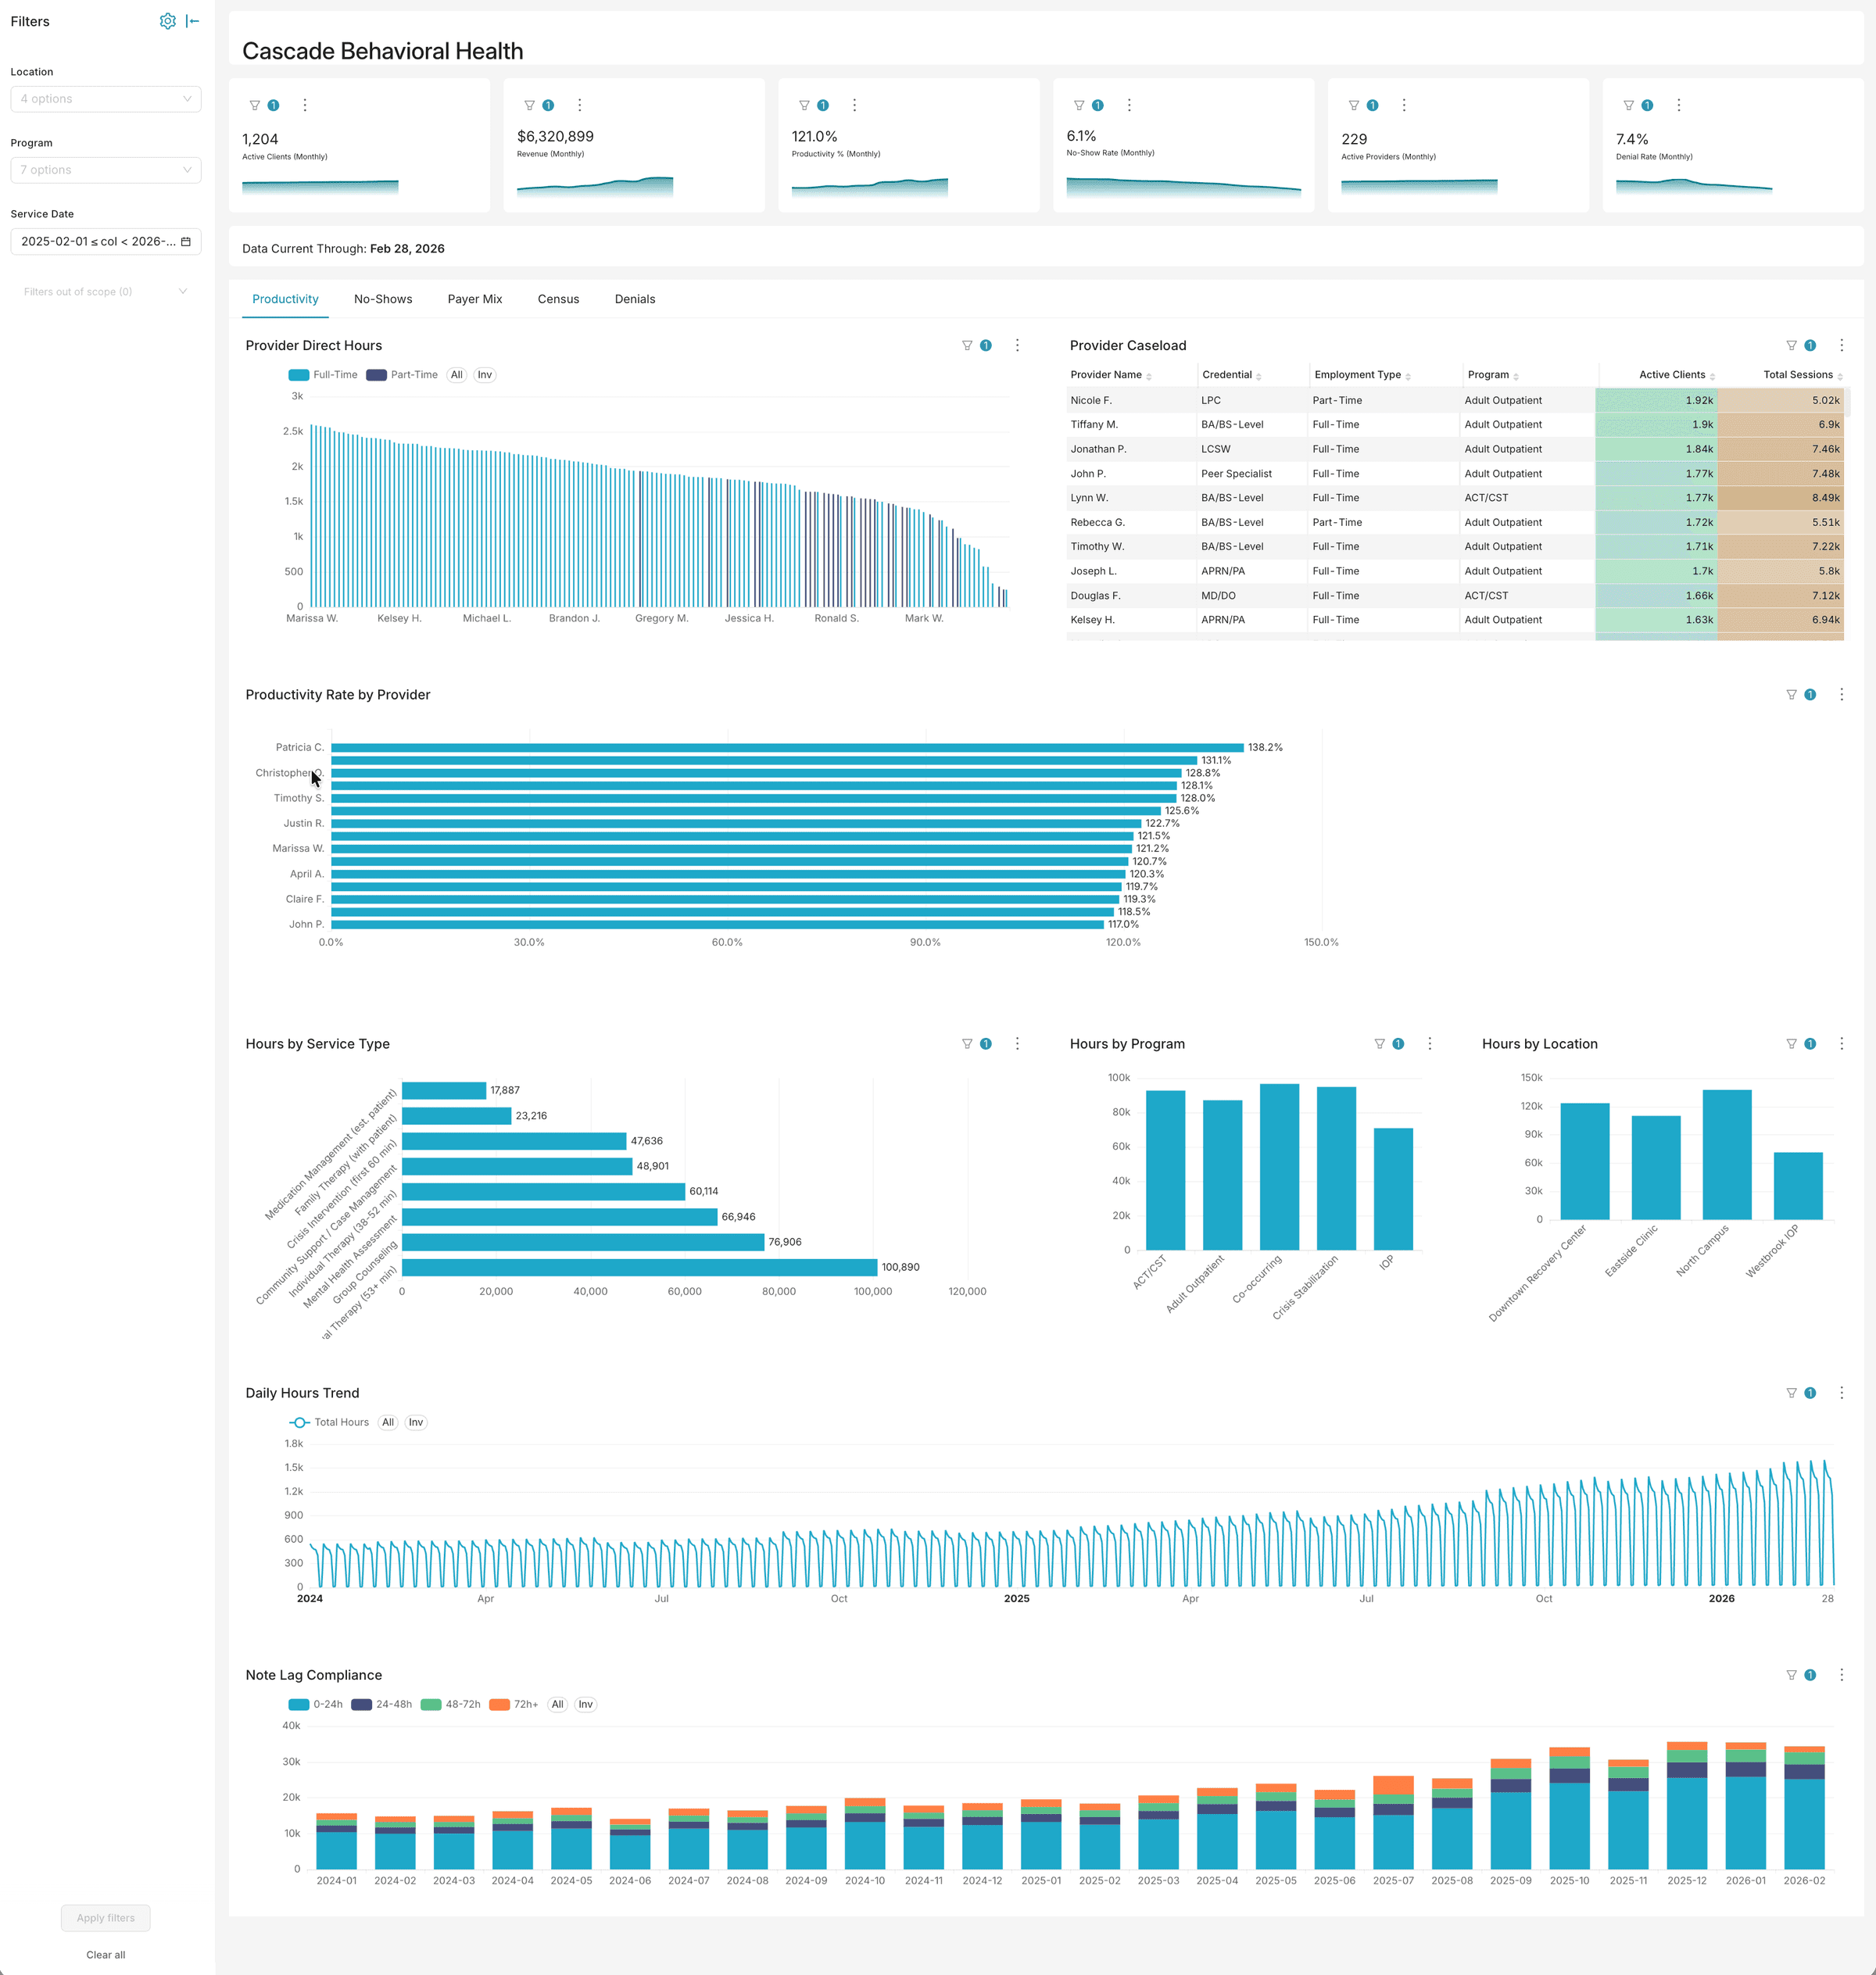
See your entire operation at a glance
Track provider productivity, caseload distribution, and revenue across all locations — updated daily from your EHR.
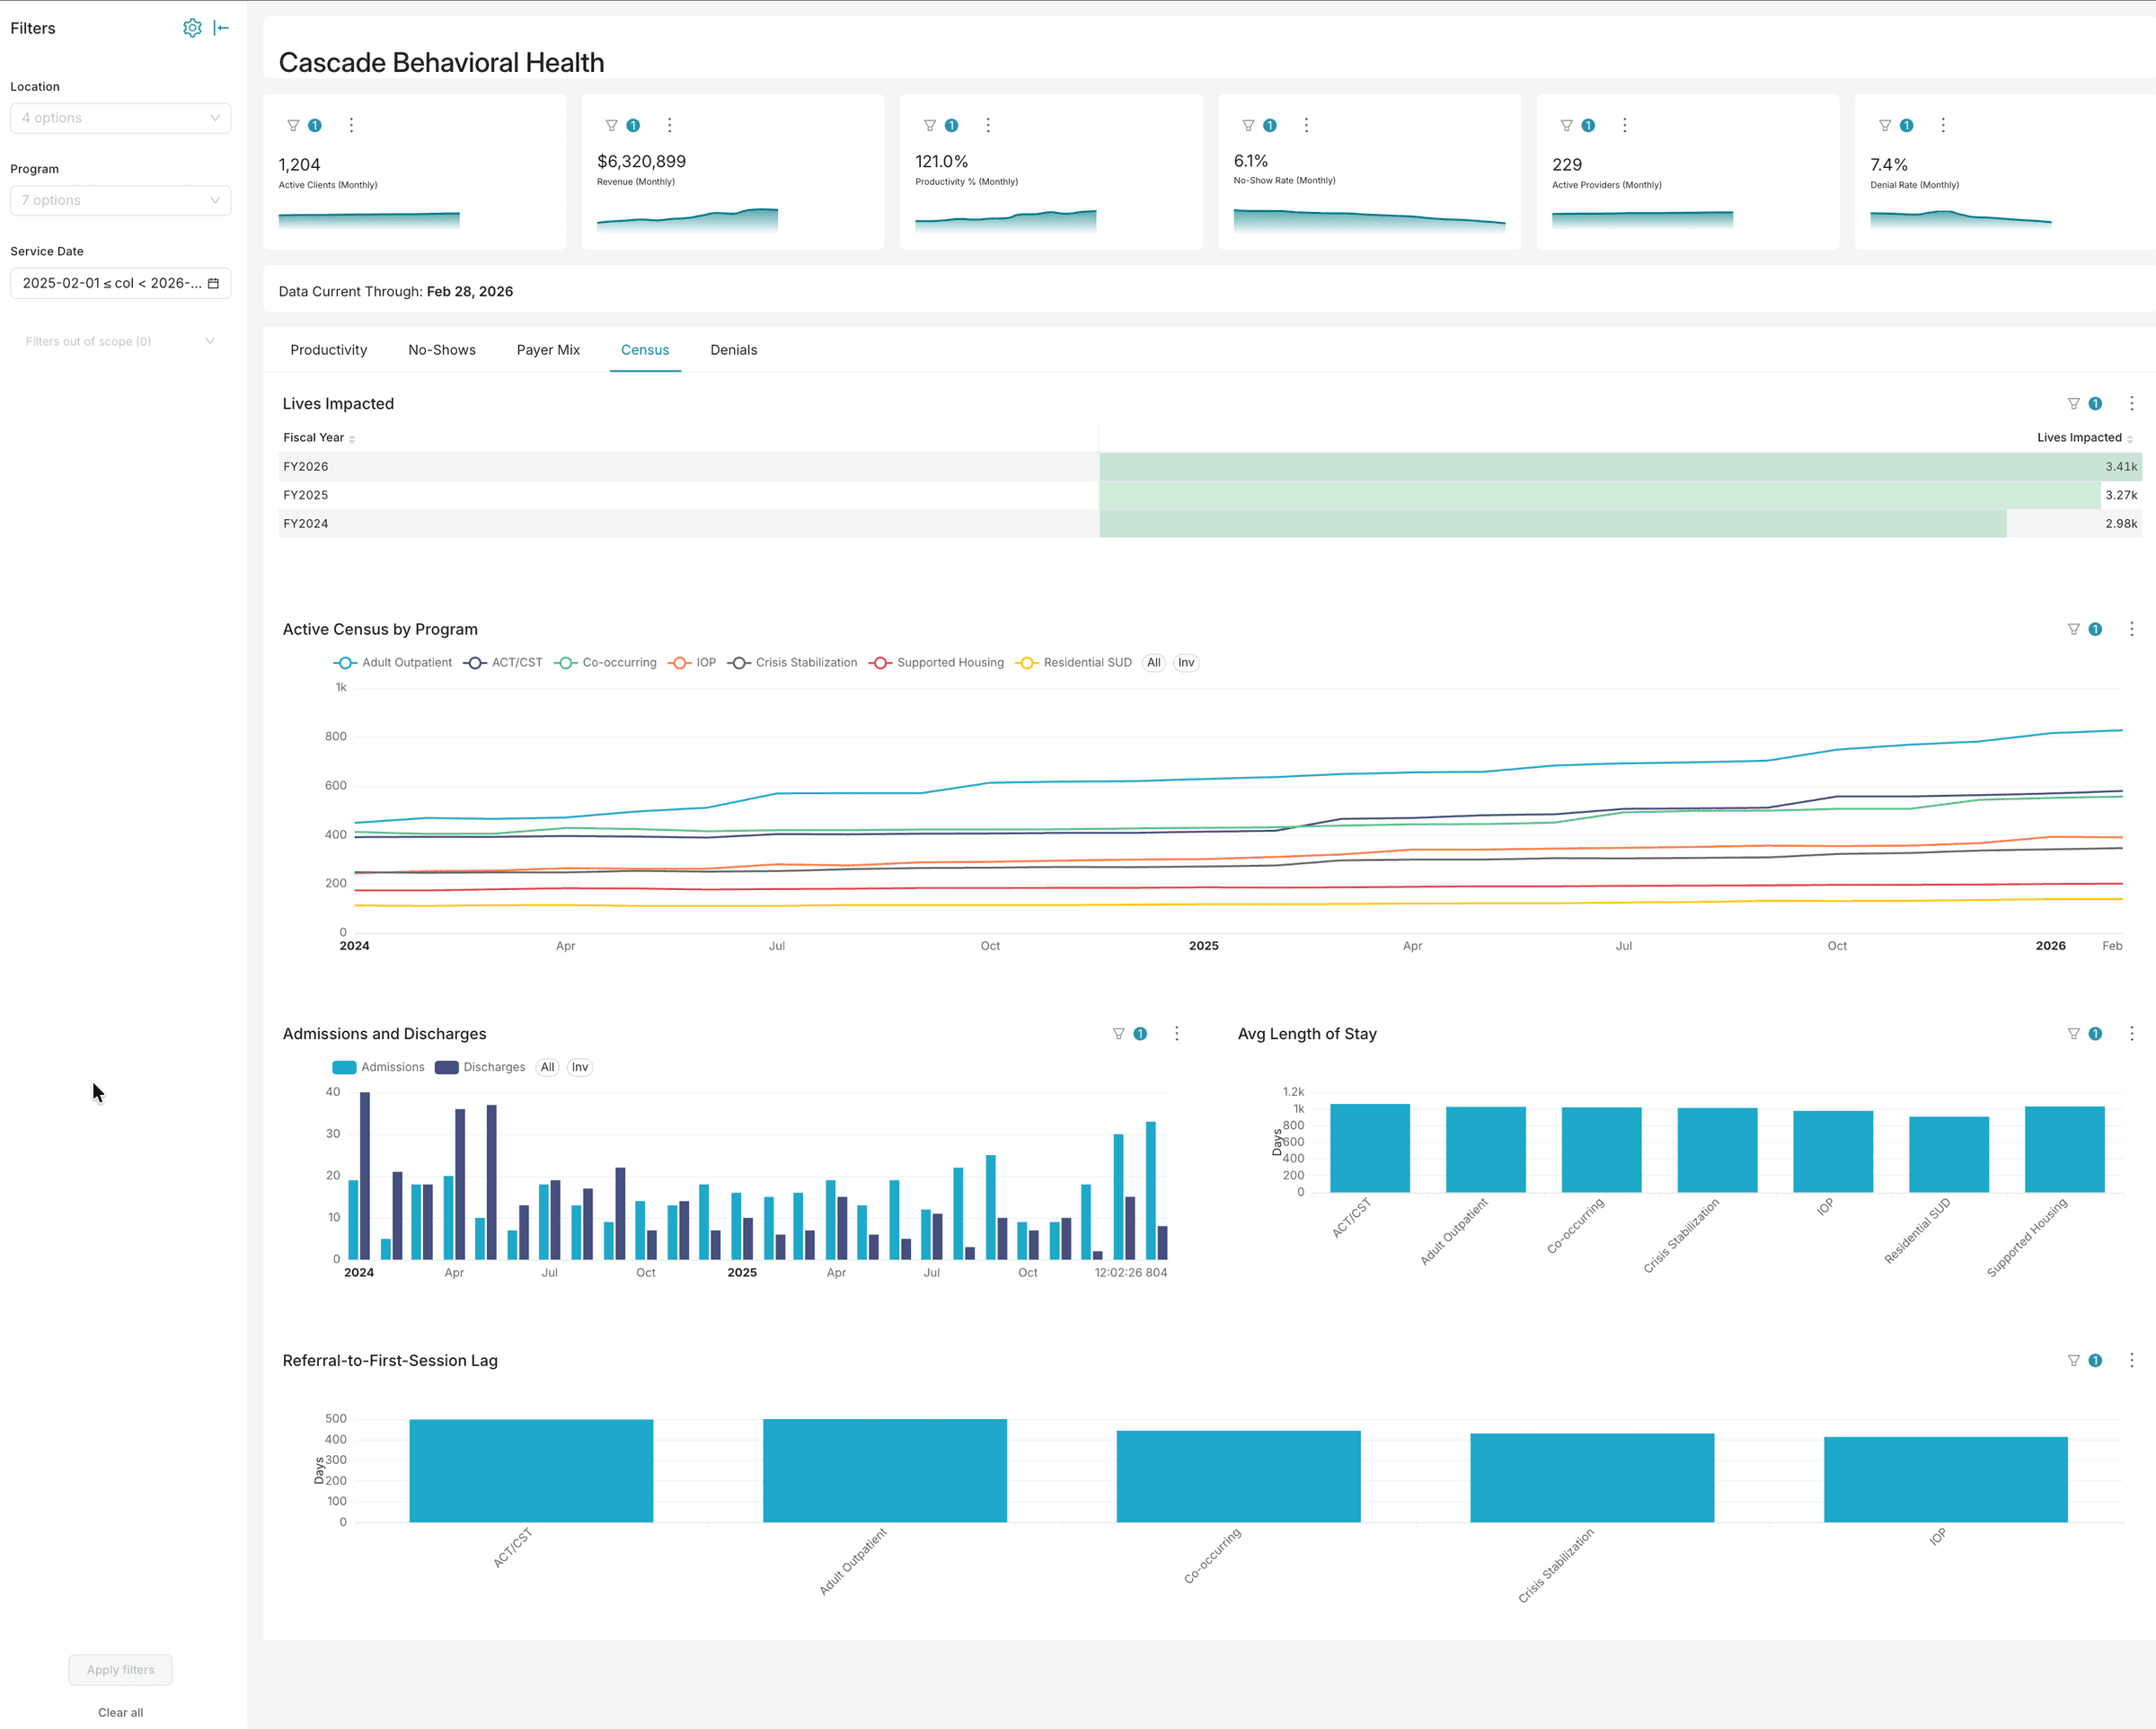
Track census, capacity, and access to care in real time
Monitor active census by program, admissions and discharge trends, average length of stay, and referral-to-first-session lag — the metrics that drive staffing and capacity decisions.
Client Result
A behavioral health organization with 90+ locations was spending hundreds of staff-hours per month compiling billing and productivity reports manually. After building the unified analytics layer, all five report categories became automated.
“You're saving hours every week… now we can pull it in 30 seconds.”
— Regional Director
How We Work
We follow a three-phase approach that most organizations complete in weeks, not quarters.
Assessment
We map your current stack, identify where each data element lives, and define the five to ten reports that would have the most operational impact if they ran automatically.
Build
We connect your source systems through a normalized data warehouse, build the reporting layer, and configure role-based access that satisfies HIPAA requirements from day one. No new EHR. No replacement of existing systems.
Adoption
We train your team to use the dashboards and own the data. The goal is an organization that does not need us to pull a report.
Get Started
Tell us what you're reporting manually today
Describe the reports your team compiles by hand — census, productivity, cross-location summaries, anything. We'll respond with a concrete picture of what automated reporting would look like for your organization.
Or email us directly:
info@visionwrights.com