
Behavioral Health · Clinical
CCBHC quality measures. Grant deliverables. PHQ-9 outcomes. None of your systems produce all of it.
Clinical data lives in the EHR. Outcomes live in a separate tool. Payroll lives in HR. We build the layer that joins them — so compliance reporting stops being a manual project.
The VisionWrights Pipeline
One unified view of your organization
We extract data from every system your organization already uses, then transform and unify it so your team stops chasing spreadsheets and starts making real-time decisions.
Your Existing Systems
EHR
NextGen · Welligent · myAvatar
Payroll
ADP · Paychex
Finance / GL
QuickBooks · NetSuite
Grant Tracking
Compliance & outcomes data
Outcomes Tools
PHQ-9 · GAD-7
auto-
extracted
VisionWrights
Data Extraction
From every source system
Transformation
Cleaned, joined, normalized
Unified
Data Lake
Org-owned. Queryable. Yours.
surfaced
instantly
What You Get
Analytics Dashboards
Real-time ops & clinical KPIs
CCBHC & Grant Reporting
Automated compliance exports
"Lives Served" Metric
Know your impact right now
Cross-Program Insights
Client overlap & program patterns
AI-Ready Data Layer
Structured for what comes next
Your Existing Systems
auto-extracted
VisionWrights Pipeline
Data Extraction
Transformation
Unified Data Lake
surfaced instantly
What You Get
Analytics Dashboards
Real-time ops & clinical KPIs
CCBHC & Grant Reporting
Automated compliance exports
"Lives Served" Metric
Know your impact right now
Cross-Program Insights
Client overlap & program patterns
AI-Ready Data Layer
Structured for what comes next
The Problem
CCBHC quality measures require data that spans your EHR, your outcome measurement tool, and sometimes your HR system. None of them were built to produce the report together. At reporting time, your team exports from each system and assembles the answer in a spreadsheet — every quarter, every grant period, every audit.
Outcome measurement has a similar gap. PHQ-9 and GAD-7 scores exist. They're just not analyzable alongside treatment and program data without a connecting layer. That gap matters for CARF documentation, value-based contracts, and demonstrating impact to funders.
We build that connecting layer. You get reports your team can run in 30 seconds instead of a weekend.
What You Get
CCBHC Quality Measure Reports
Automated calculation on calendar-year and custom grant-period bases, with drill-down by program — no quarterly spreadsheet assembly.
Outcome Measurement Visibility
PHQ-9, GAD-7, and other instruments analyzed alongside treatment and program data in one connected view.
Grant Deliverable Tracking
Client counts and service units on any grant-year calendar — no manual extraction at reporting time.
Compliance Exports
SAMHSA URS, 42 CFR Part 2, CARF MIC documentation — generated automatically from your unified data layer.
Caseload and Productivity Views
Caseload size and billable hours by clinician — connected to credential and program data for accurate compliance documentation.
See It In Action
Purpose-built dashboards, not generic charts
Every view is designed for behavioral health workflows — built from your EHR data, updated daily, ready to use from day one.
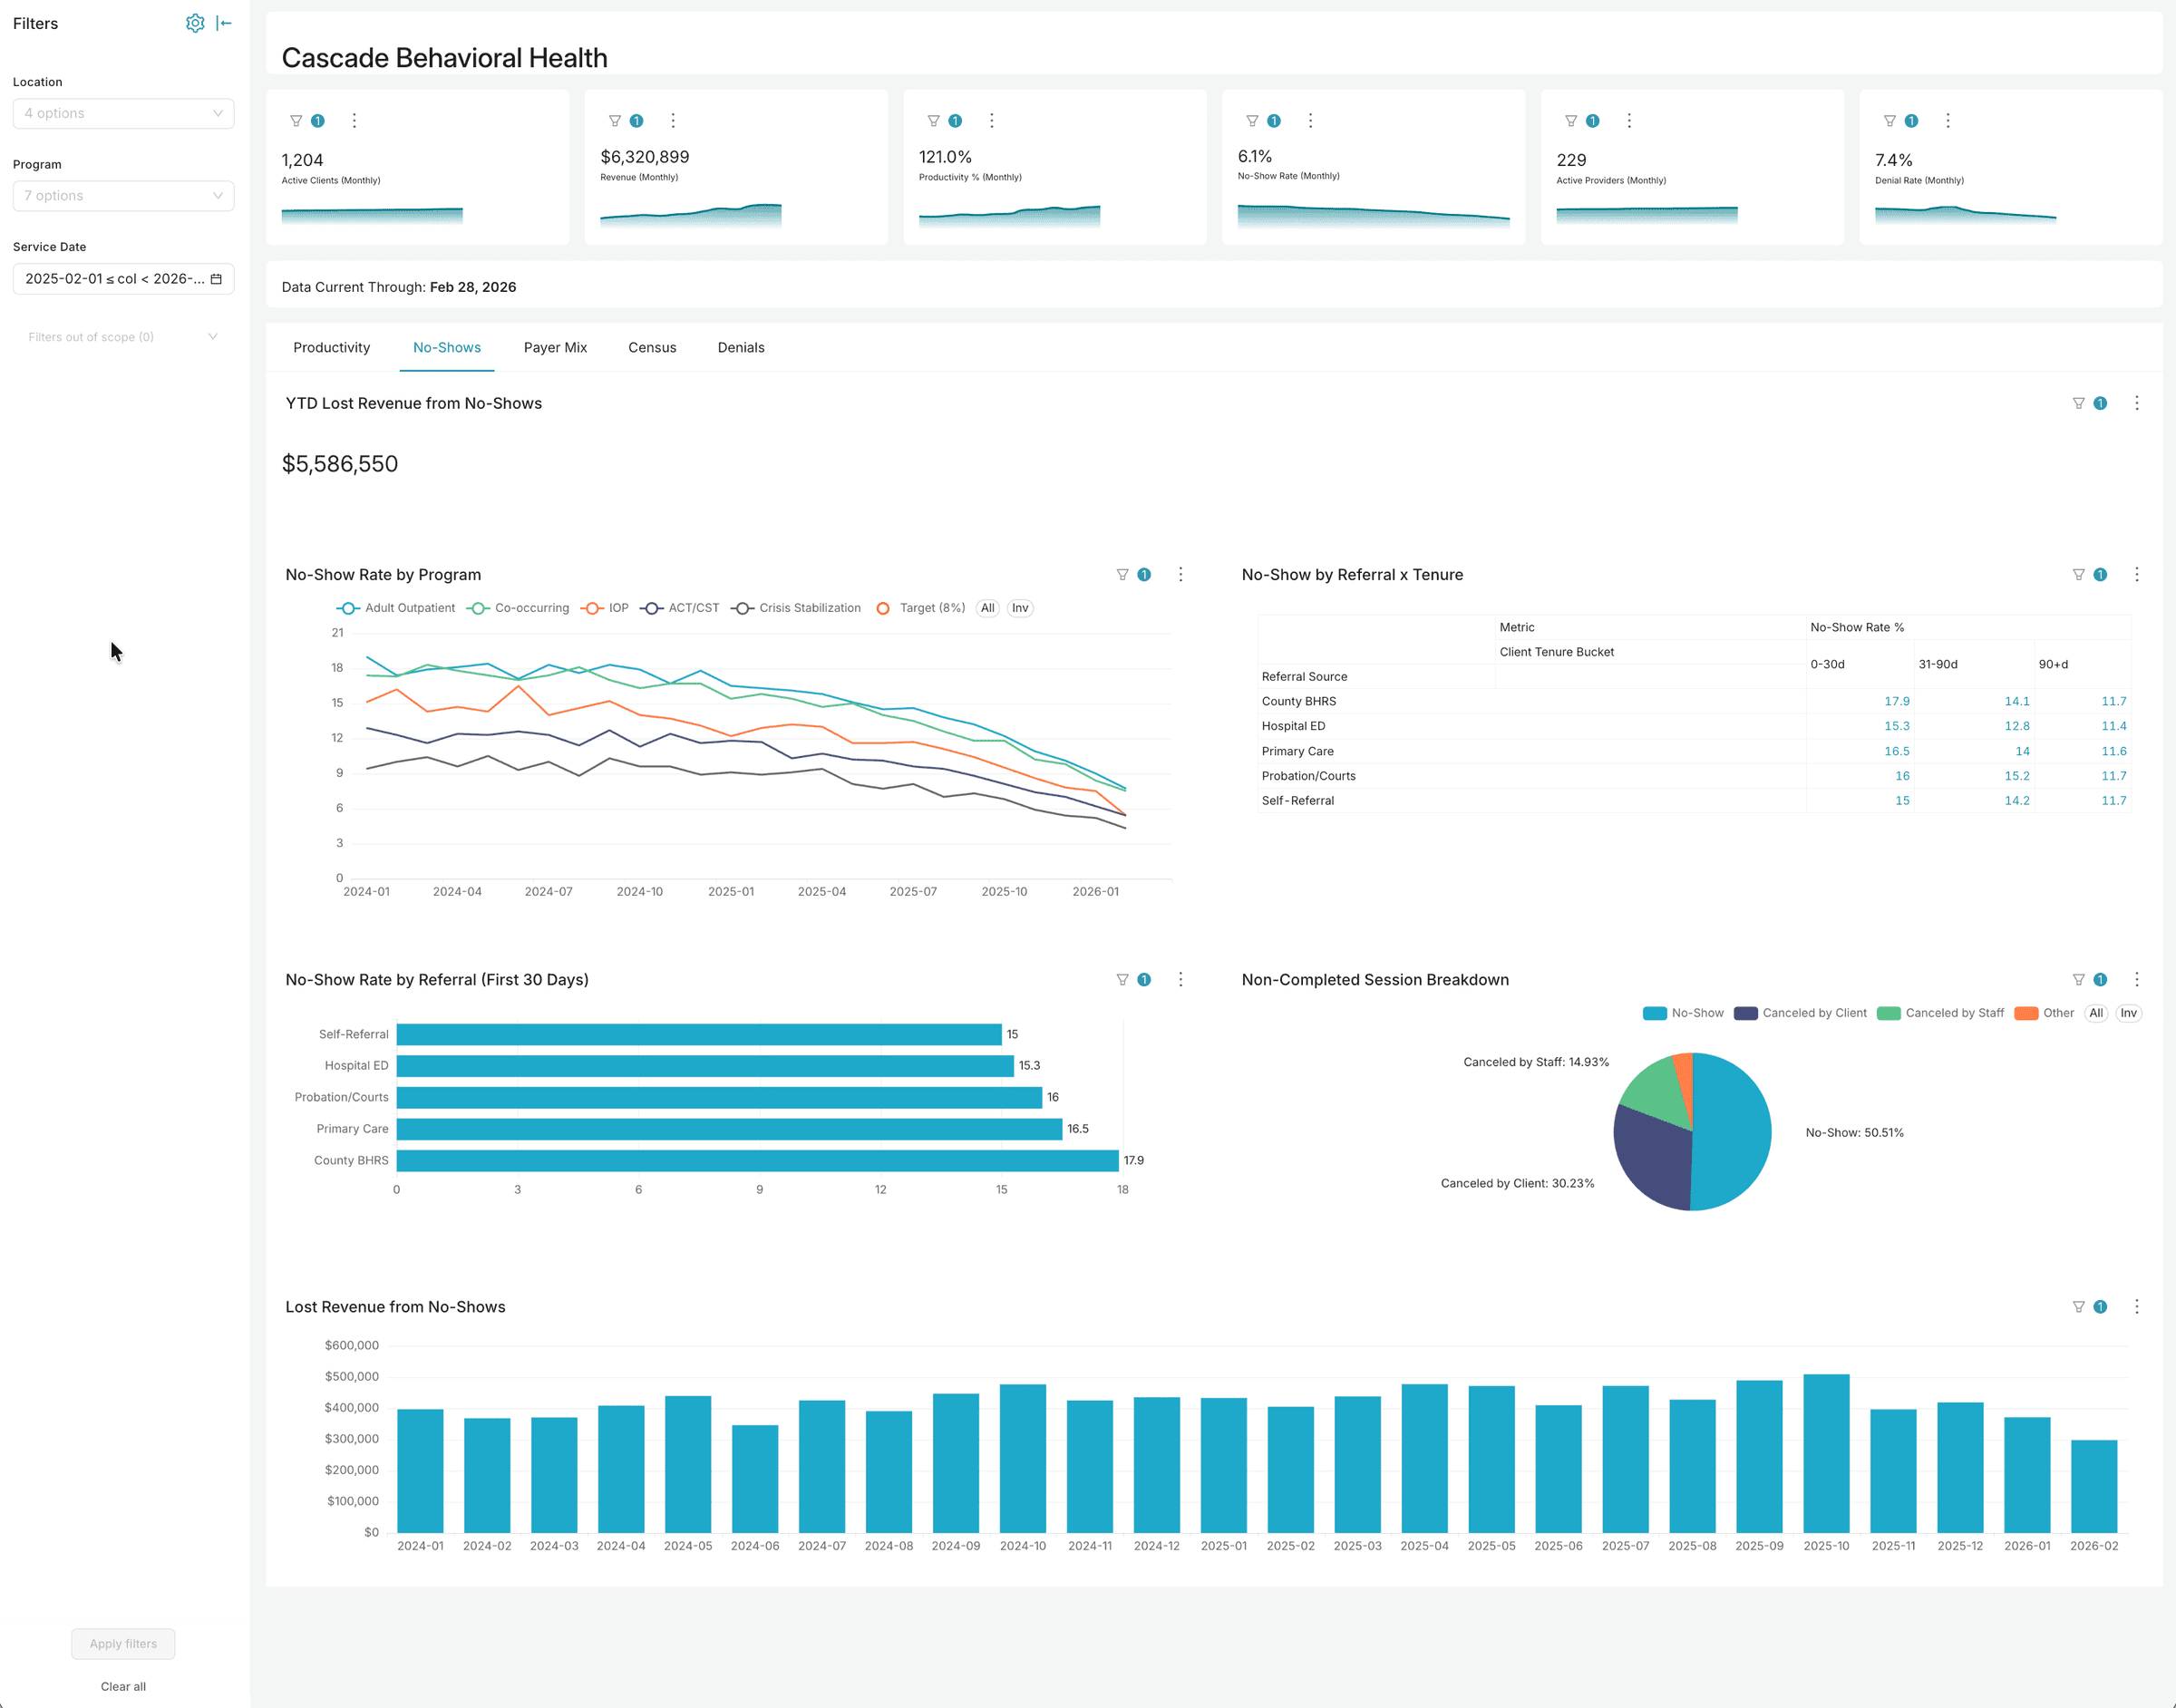
Turn no-show patterns into intervention opportunities
Identify which programs, referral sources, and client tenure buckets drive no-shows — then target your engagement efforts where they’ll have the most impact.
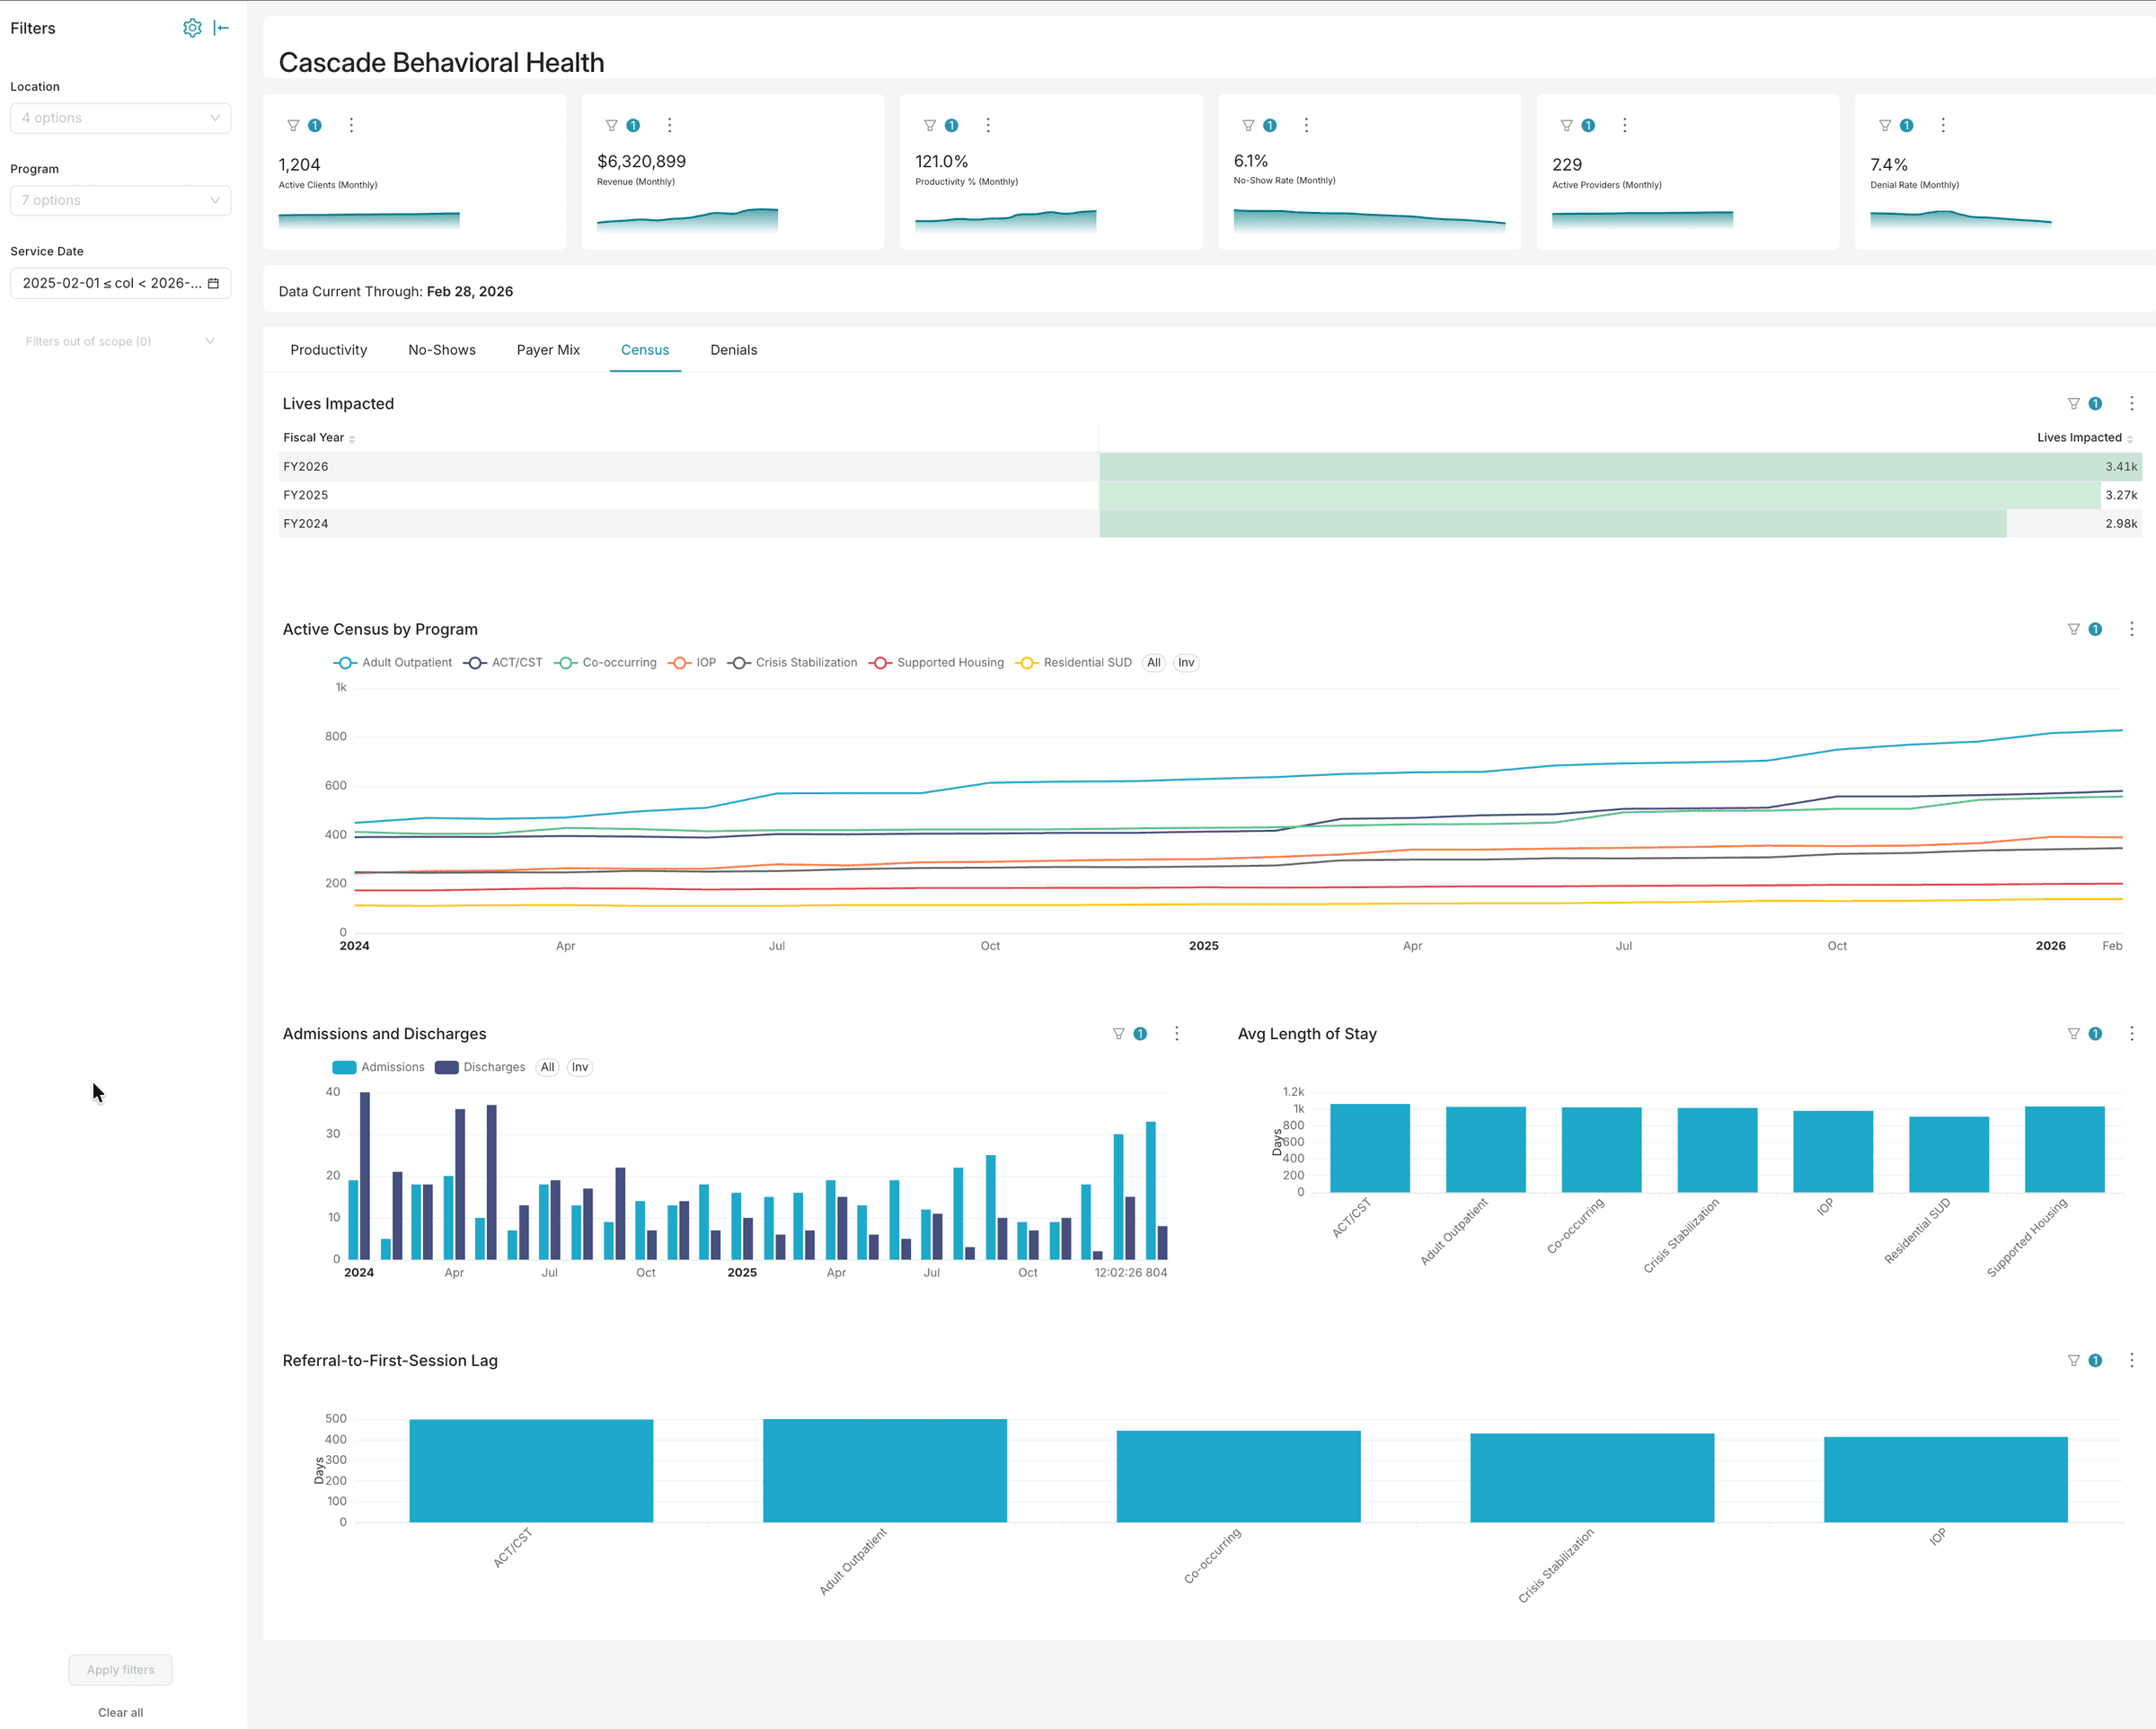
Track census, capacity, and access to care in real time
Monitor active census by program, admissions and discharge trends, average length of stay, and referral-to-first-session lag — the metrics that drive staffing and capacity decisions.
Client Result
A behavioral health organization operating across 90+ locations automated grant deliverable tracking, clinical compliance exports, and staff productivity reporting. Reporting that required hours of manual work became available on demand.
“This looks outstanding. I'm very excited about it.”
— Regional Director
How We Work
We follow a three-phase approach that most organizations complete in weeks, not quarters.
Assessment
We map your current stack, identify where each data element lives, and define the five to ten reports that would have the most operational impact if they ran automatically.
Build
We connect your source systems through a normalized data warehouse, build the reporting layer, and configure role-based access that satisfies HIPAA requirements from day one. No new EHR. No replacement of existing systems.
Adoption
We train your team to use the dashboards and own the data. The goal is an organization that does not need us to pull a report.
Get Started
Tell us which compliance reports you still compile by hand
Describe which CCBHC, grant, or outcome reports your team still assembles manually — and how much time it takes. We'll show you what automated compliance reporting looks like for your organization.
Or email us directly:
info@visionwrights.com