Behavioral Health · Finance
10–20% of behavioral health revenue is lost to preventable denials. Most organizations can't see which ones.
Fewer than 1% of denied claims are appealed — not because they aren't valid, but because organizations can't identify the patterns. We fix that.
The VisionWrights Pipeline
One unified view of your organization
We extract data from every system your organization already uses, then transform and unify it so your team stops chasing spreadsheets and starts making real-time decisions.
Your Existing Systems
EHR
NextGen · Welligent · myAvatar
Payroll
ADP · Paychex
Finance / GL
QuickBooks · NetSuite
Grant Tracking
Compliance & outcomes data
Outcomes Tools
PHQ-9 · GAD-7
auto-
extracted
VisionWrights
Data Extraction
From every source system
Transformation
Cleaned, joined, normalized
Unified
Data Lake
Org-owned. Queryable. Yours.
surfaced
instantly
What You Get
Analytics Dashboards
Real-time ops & clinical KPIs
CCBHC & Grant Reporting
Automated compliance exports
"Lives Served" Metric
Know your impact right now
Cross-Program Insights
Client overlap & program patterns
AI-Ready Data Layer
Structured for what comes next
Your Existing Systems
auto-extracted
VisionWrights Pipeline
Data Extraction
Transformation
Unified Data Lake
surfaced instantly
What You Get
Analytics Dashboards
Real-time ops & clinical KPIs
CCBHC & Grant Reporting
Automated compliance exports
"Lives Served" Metric
Know your impact right now
Cross-Program Insights
Client overlap & program patterns
AI-Ready Data Layer
Structured for what comes next
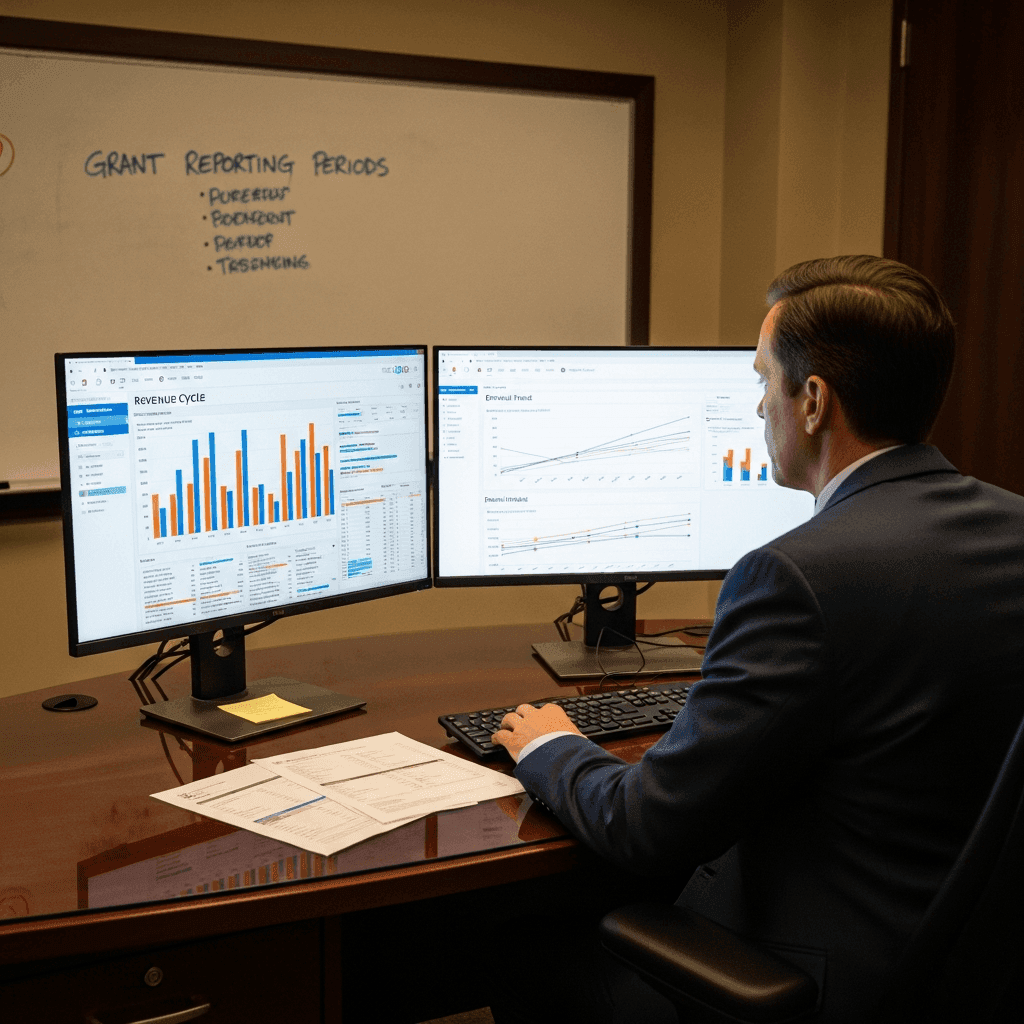
The Problem
Your billing team knows denials are happening. They don't know which payers are denying which service types at which locations, or whether the same denial reason keeps appearing in the same program. That pattern is in the data — it's just spread across systems that don't talk to each other.
Grant reporting has the same problem. Performance periods don't align with your fiscal year. Quality measures require data from the EHR, the outcome tool, and sometimes HR. At reporting time, someone is pulling all of it by hand.
We build the reporting layer that connects these systems — so your finance team sees patterns, not just totals.
What You Get
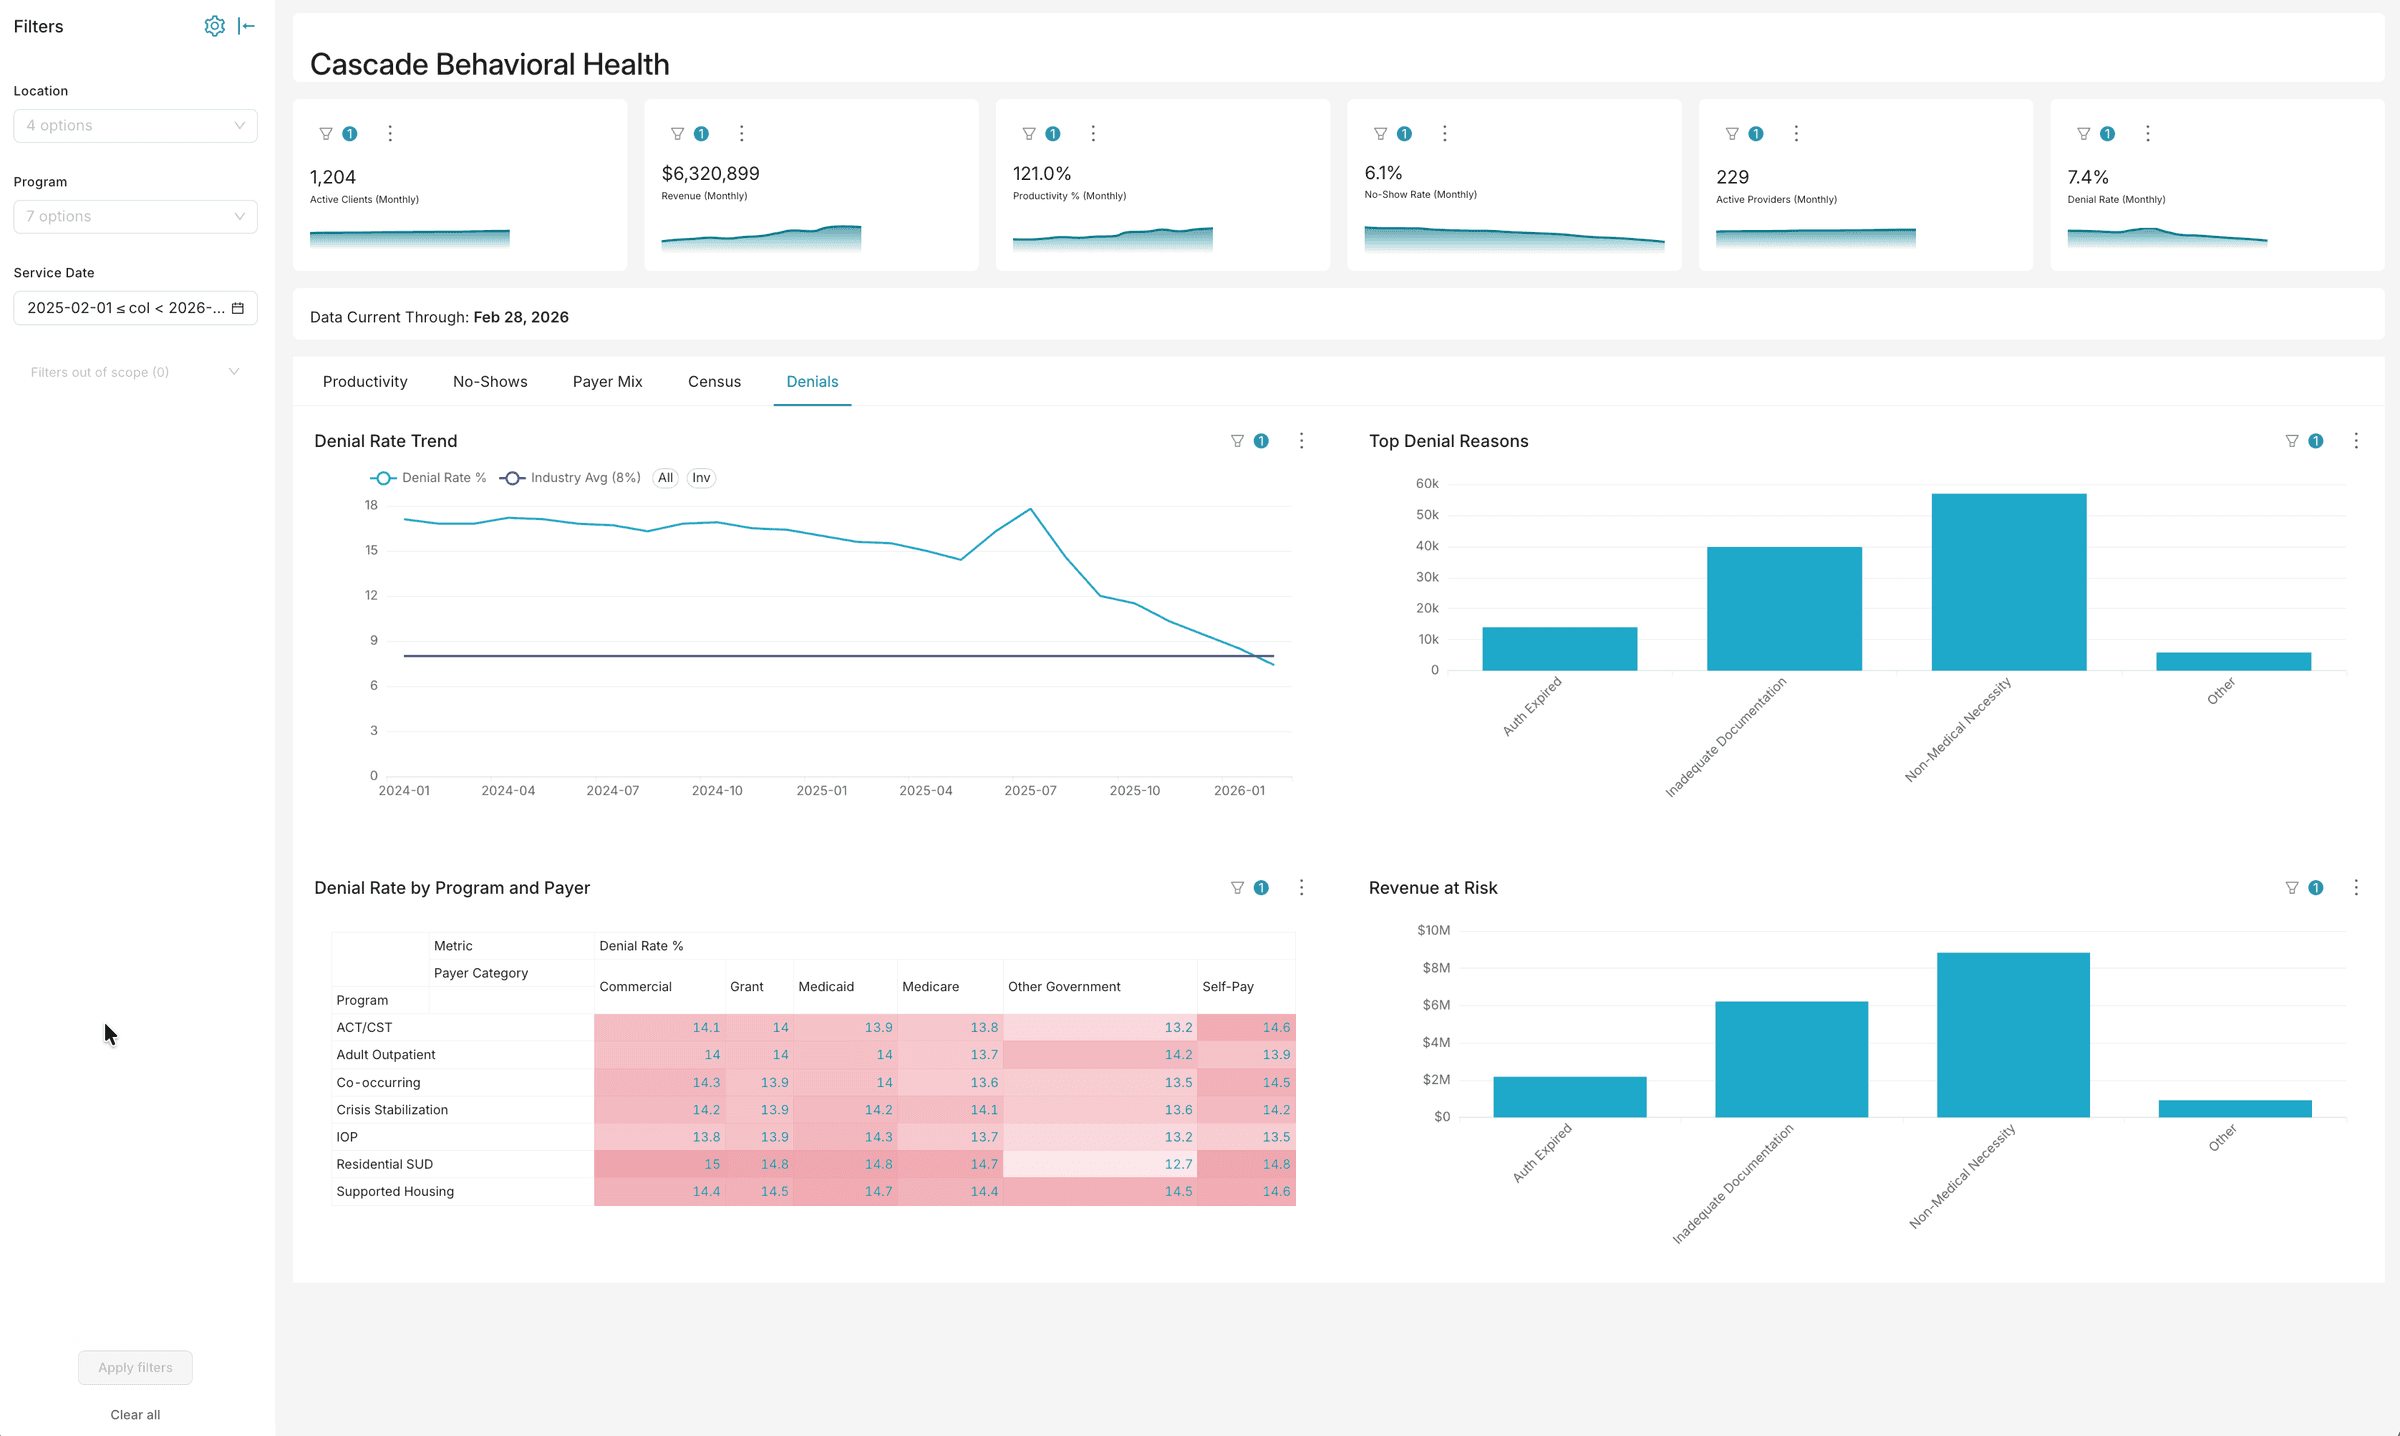
Denial Trend Analysis
Denial rates and reasons by payer, service type, and program — updated automatically so patterns surface before they compound.
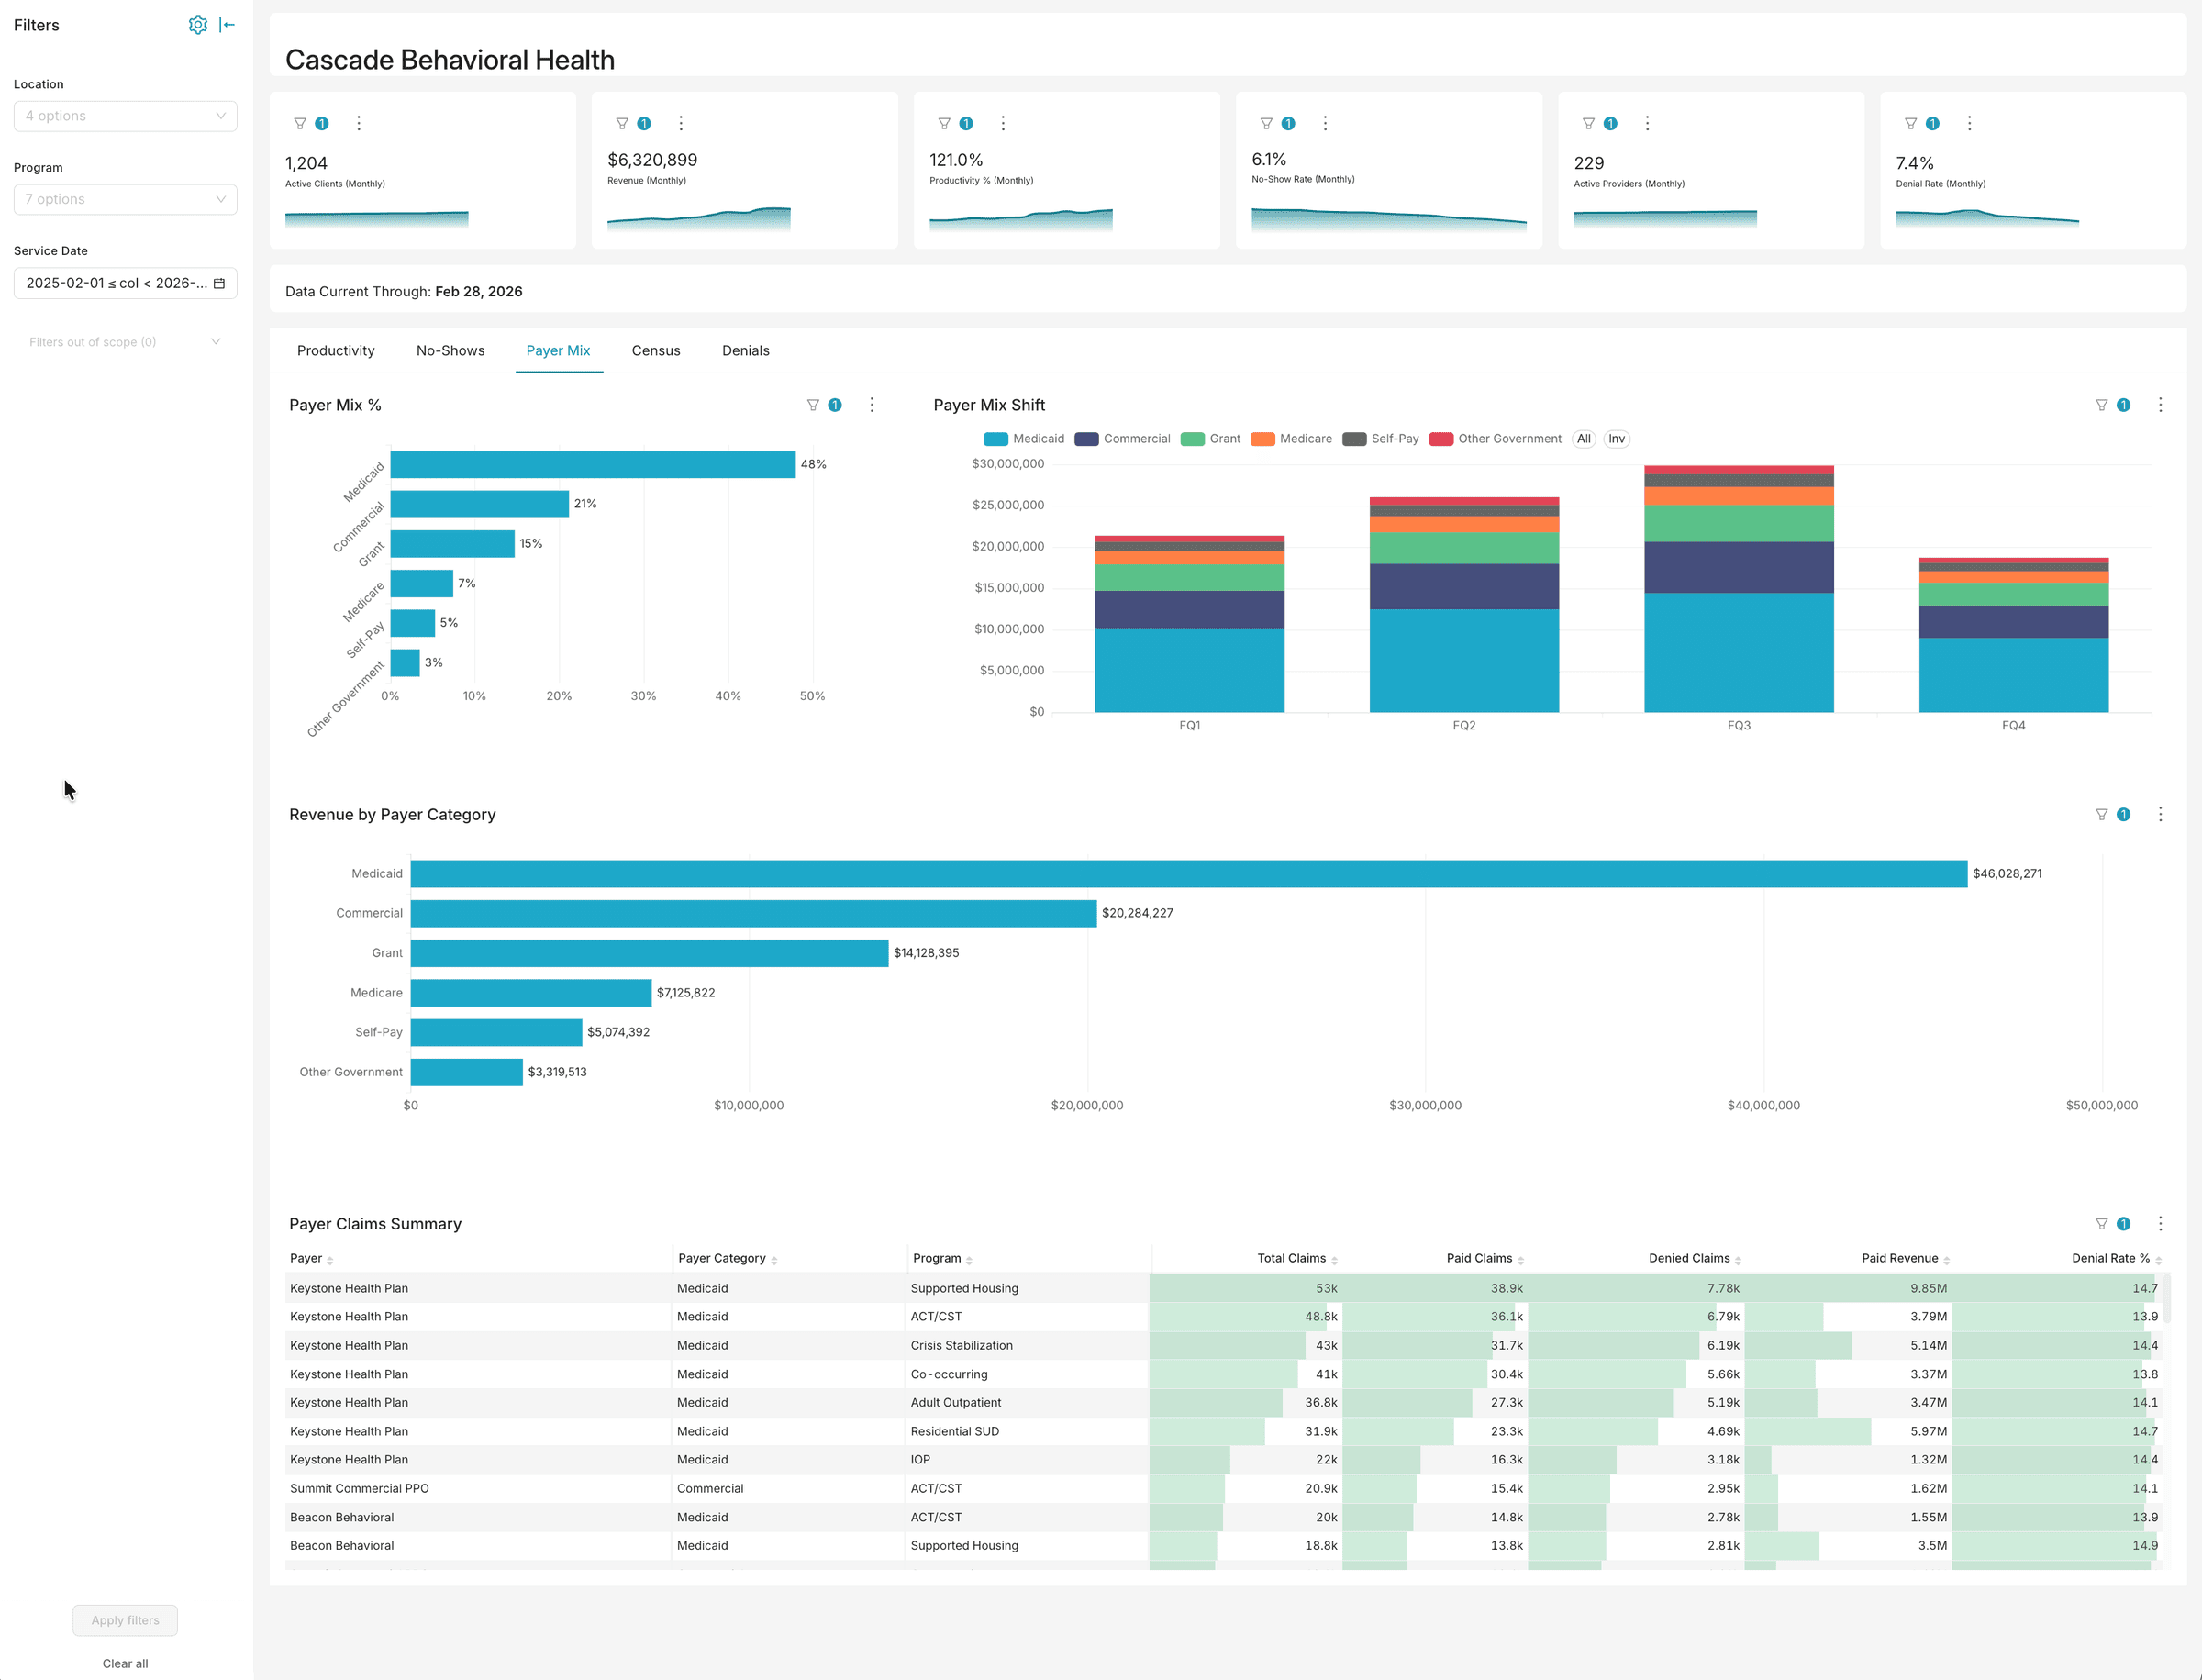
Payer Mix by Program
Medicaid, grant, and commercial breakdown per program — not just org-wide totals that obscure program-level risk.
Grant Deliverable Tracking
Client counts, service units, and outcome data on any grant-year calendar — no manual extraction at reporting time.
Revenue Cycle Visibility
Billing status, aging, and denial trends in one dashboard — so your finance team sees patterns, not just totals.
Payroll Prep Automation
Payroll-ready output from productivity and attendance data — reduces manual reconciliation between HR and finance.
See It In Action
Purpose-built dashboards, not generic charts
Every view is designed for behavioral health workflows — built from your EHR data, updated daily, ready to use from day one.
Know exactly where your revenue comes from — and where it’s at risk
Break down claims volume, paid revenue, and denial rates by payer and program. Spot payer-specific denial patterns before they become cash flow problems.
Track denials against industry benchmarks and see the dollars at stake
Monitor denial rates by reason, quantify revenue at risk, and identify documentation gaps driving preventable denials.
Client Result
At a 90-location behavioral health organization, automating billing and payroll reporting projected significant annual savings in staff time. The finance team went from weekly manual extraction to on-demand dashboards.
“If the hours-worked numbers are accurate, this is a game changer.”
— Operations Leader
How We Work
We follow a three-phase approach that most organizations complete in weeks, not quarters.
Assessment
We map your current stack, identify where each data element lives, and define the five to ten reports that would have the most operational impact if they ran automatically.
Build
We connect your source systems through a normalized data warehouse, build the reporting layer, and configure role-based access that satisfies HIPAA requirements from day one. No new EHR. No replacement of existing systems.
Adoption
We train your team to use the dashboards and own the data. The goal is an organization that does not need us to pull a report.
Get Started
Show us where your revenue is leaking
Tell us which revenue cycle or financial reports your team still compiles manually. We'll show you exactly what automated denial analysis and grant tracking would look like for your organization.
Or email us directly:
info@visionwrights.com